Your Real Estate Guide To
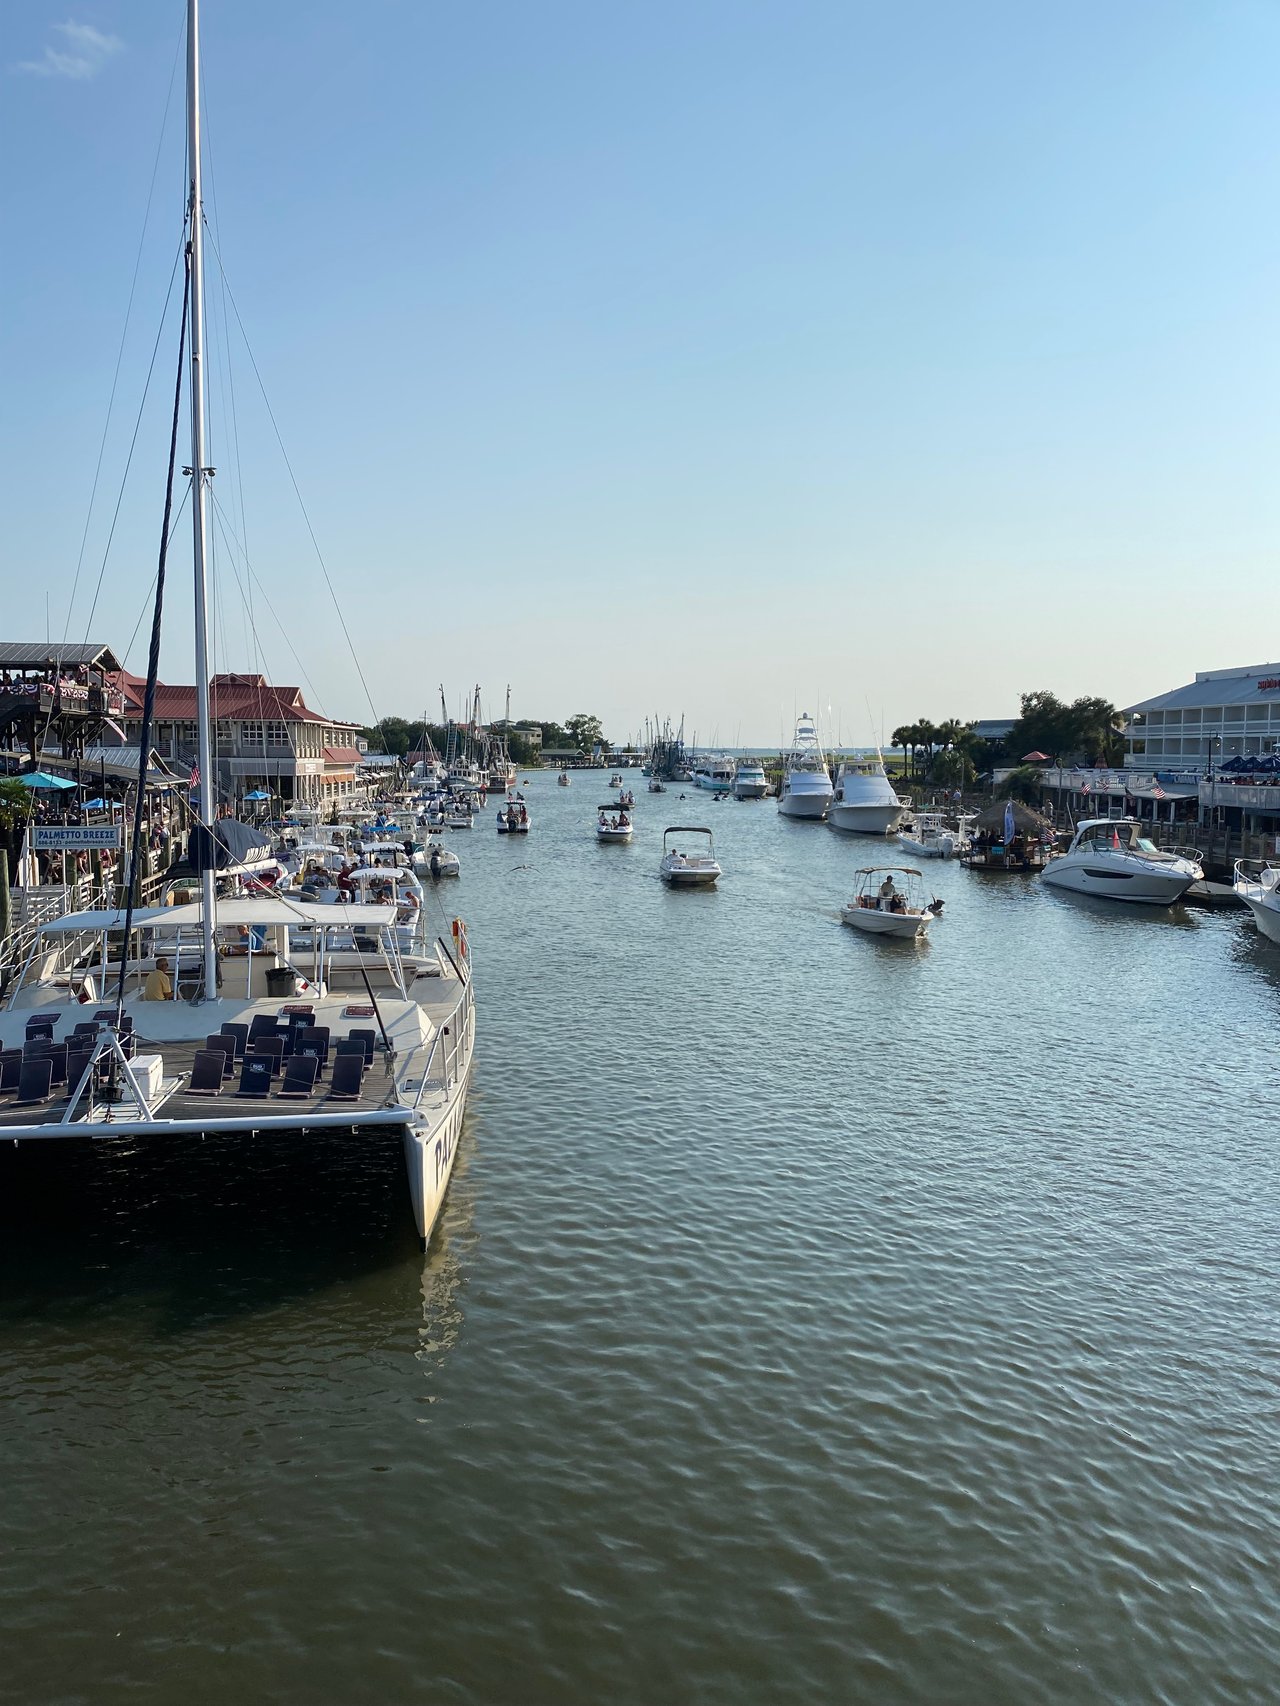
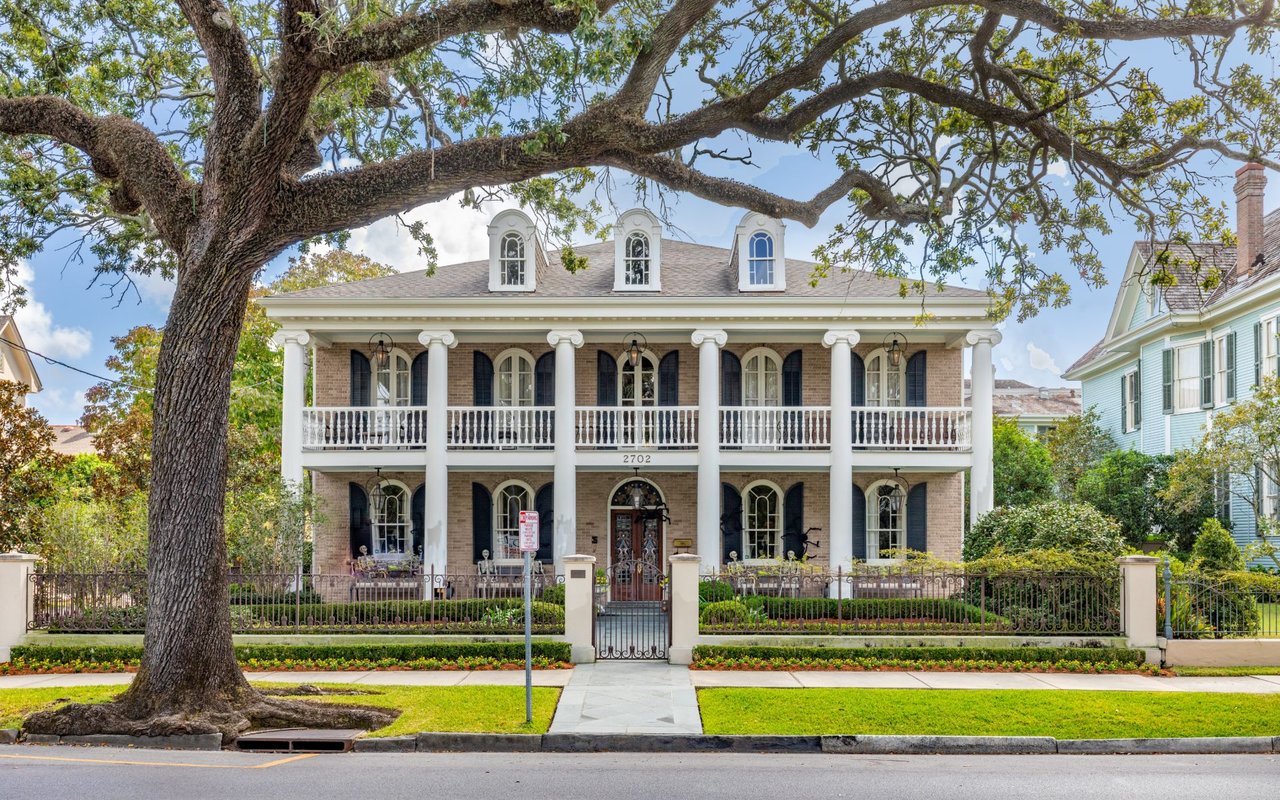
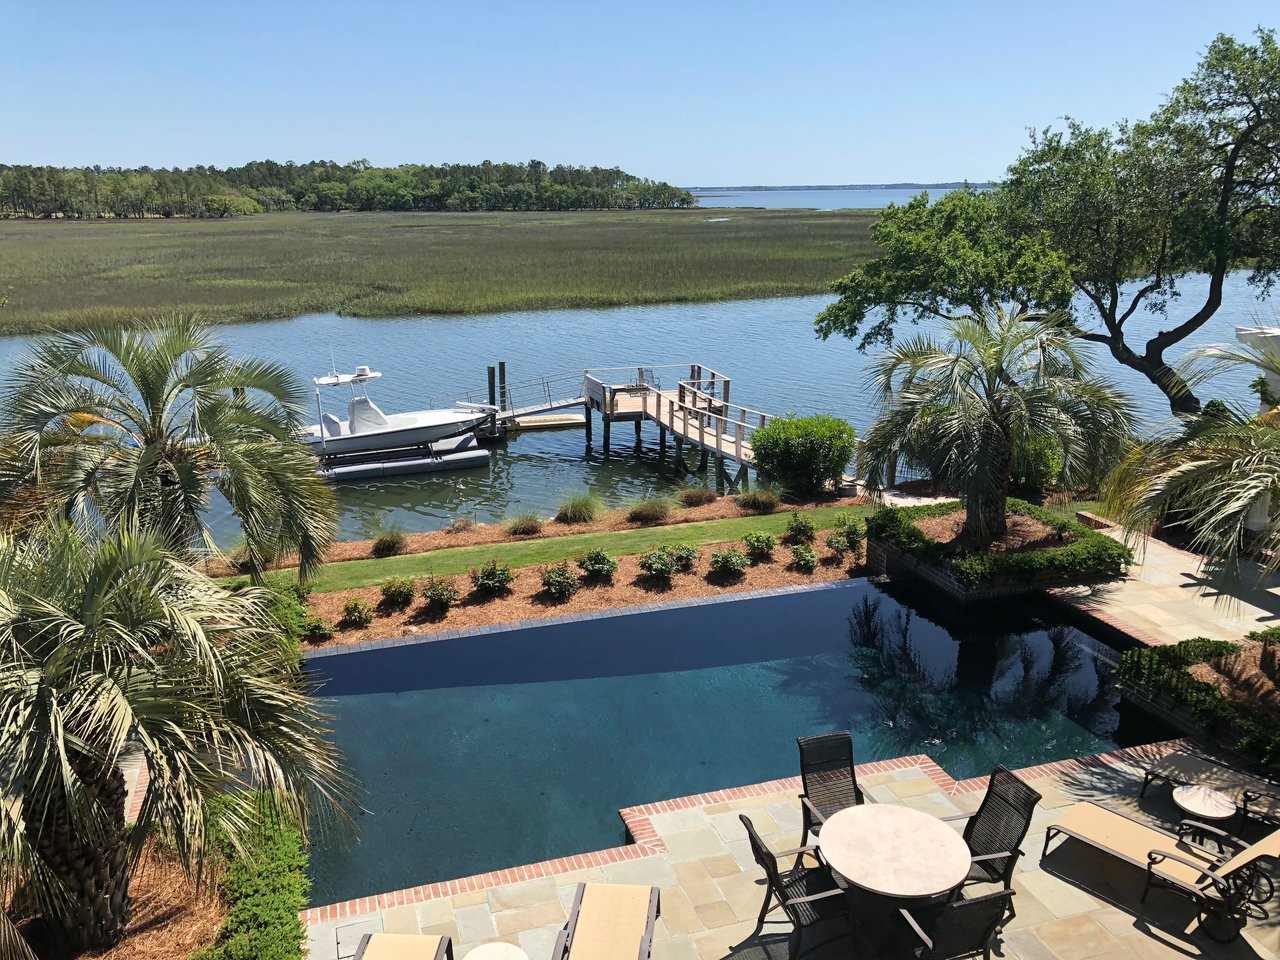
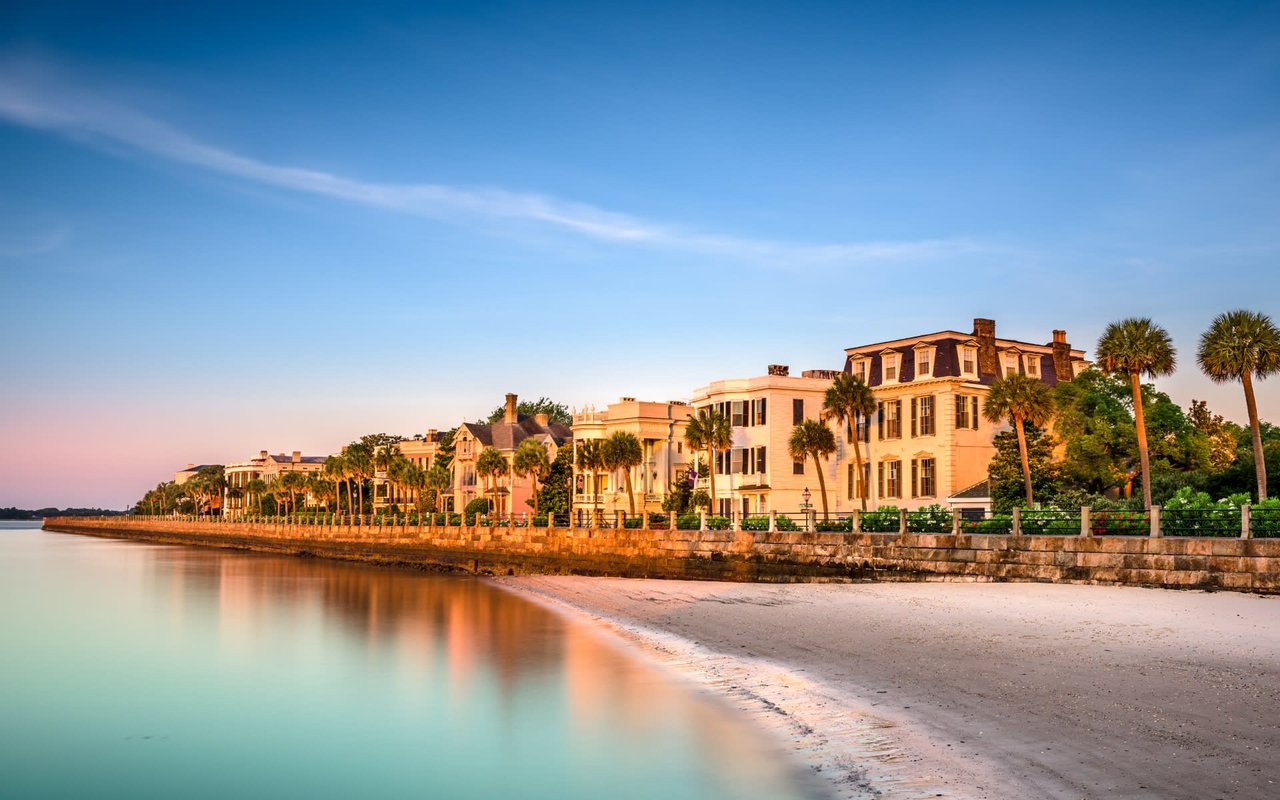
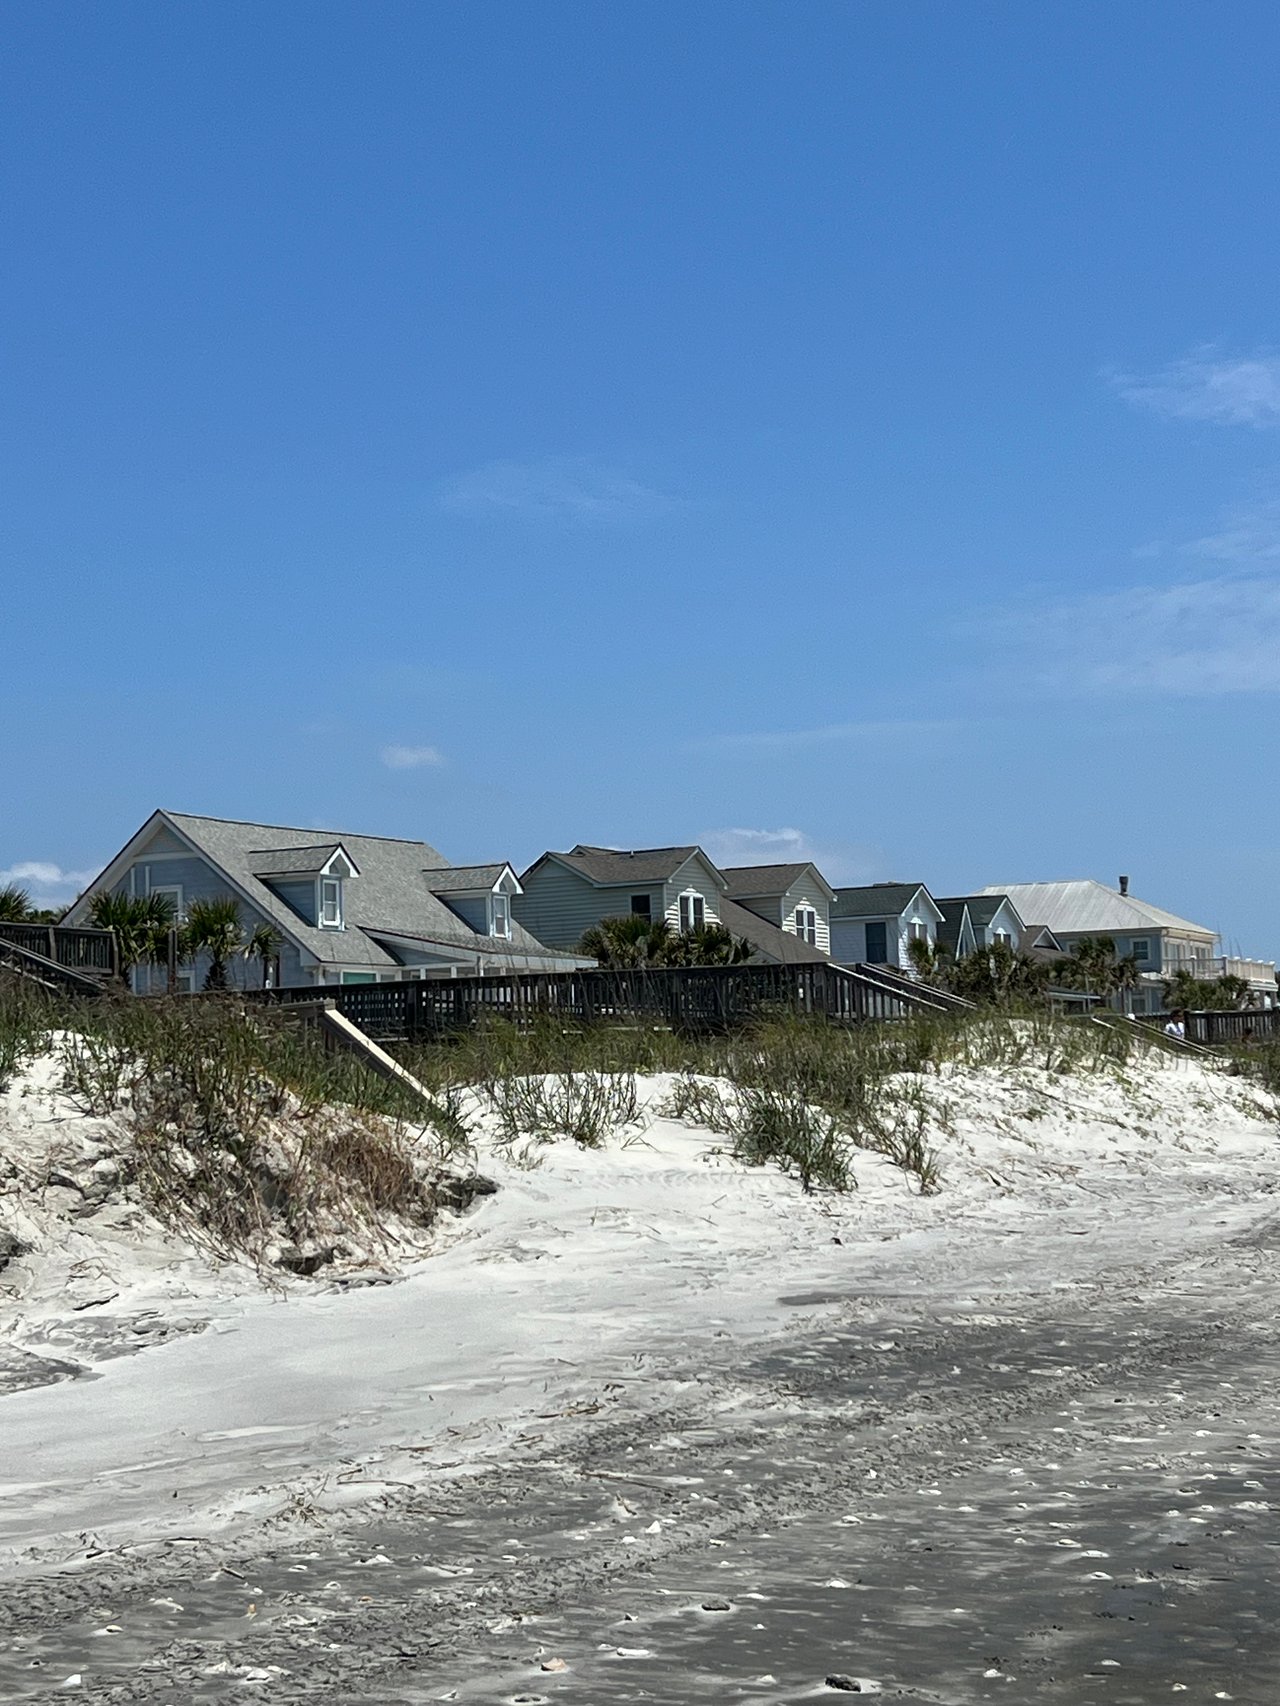
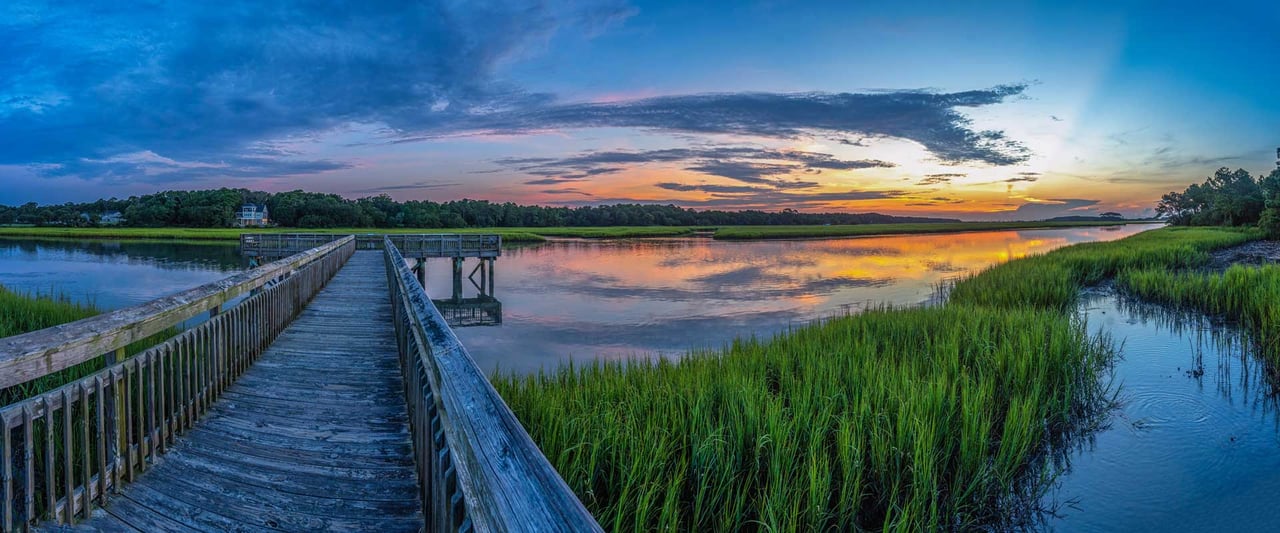
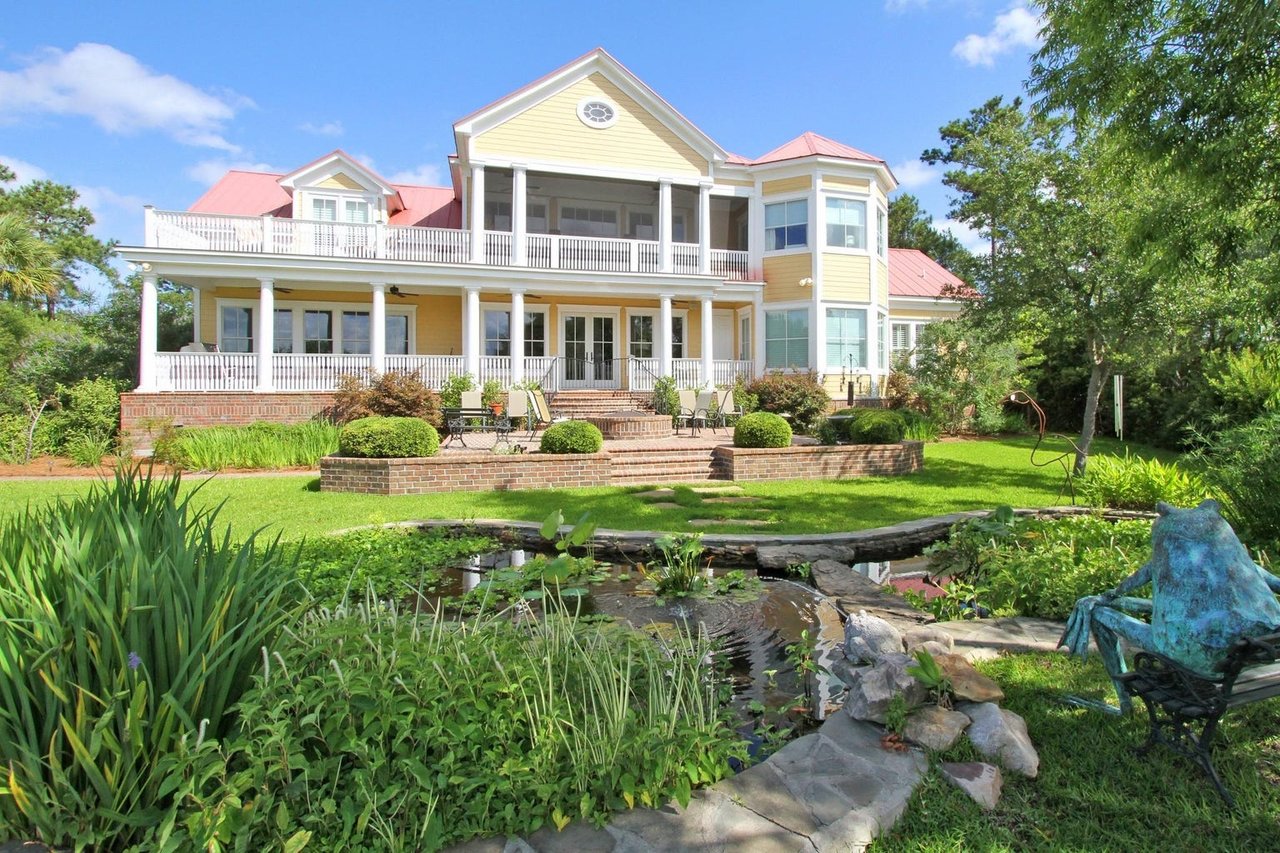
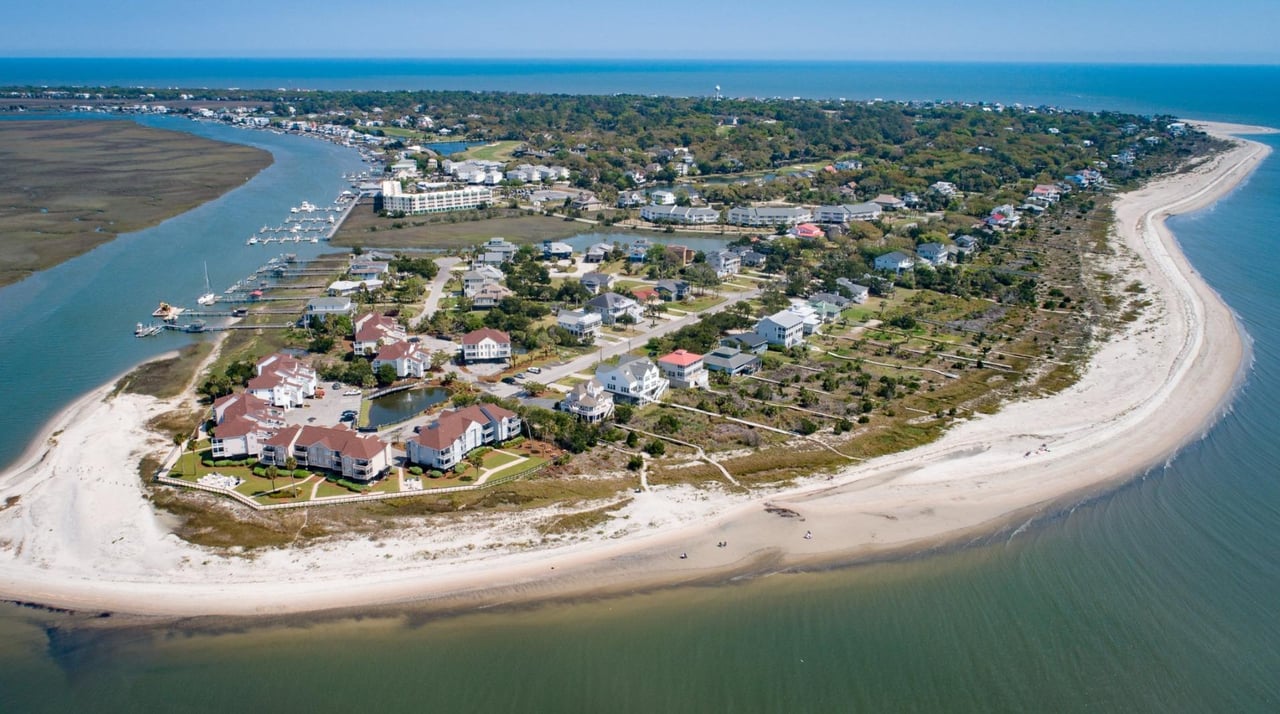
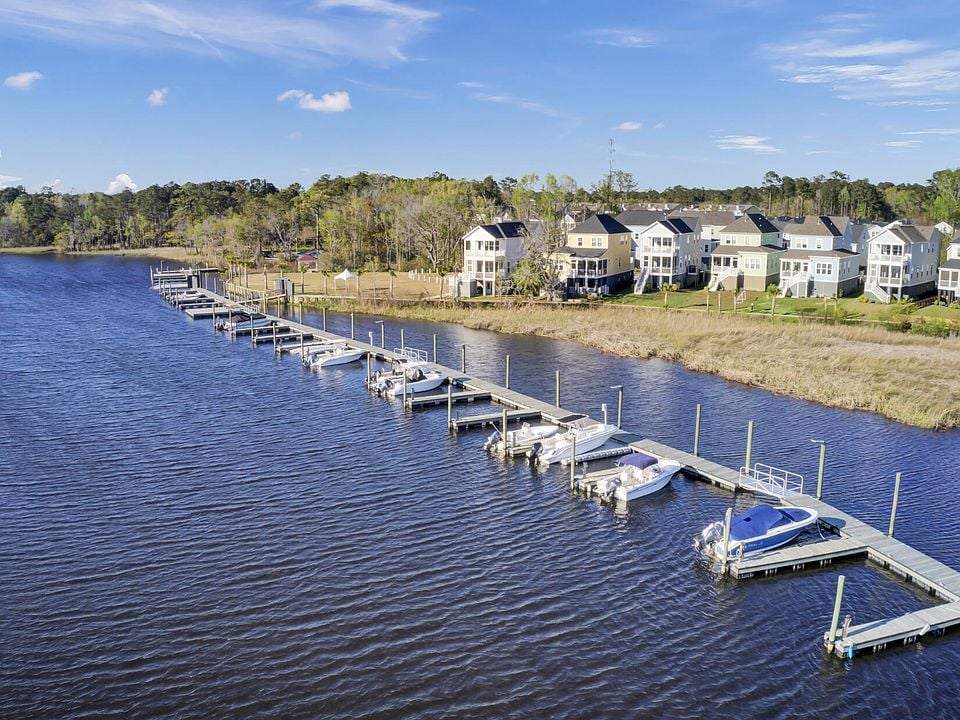
North Charleston is a dynamic and diverse city, offering modern convenience, and excellent access to Charleston International Airport, major employers, and I-26. Real estate options range from restored homes in Park Circle to new construction communities and waterfront properties along the Cooper River.
Neighborhoods & Lifestyle
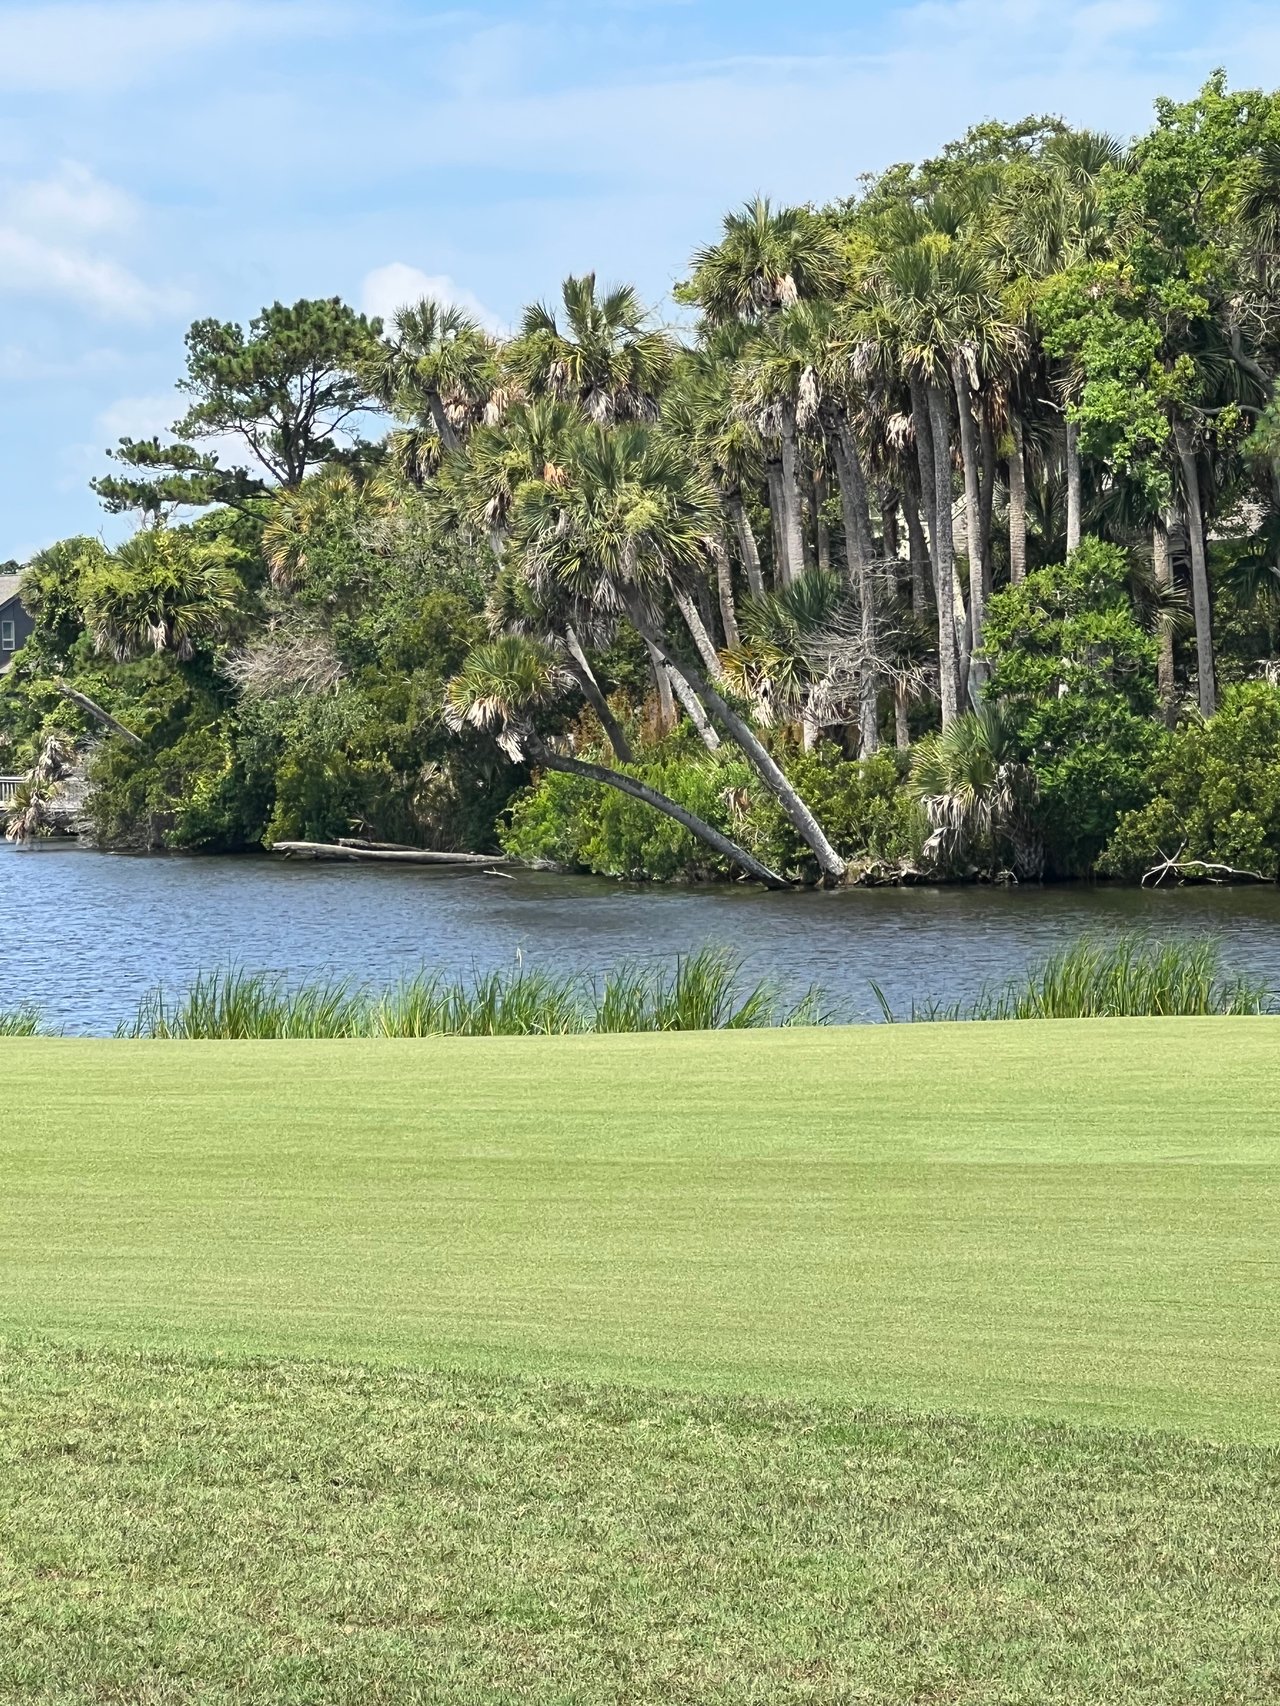
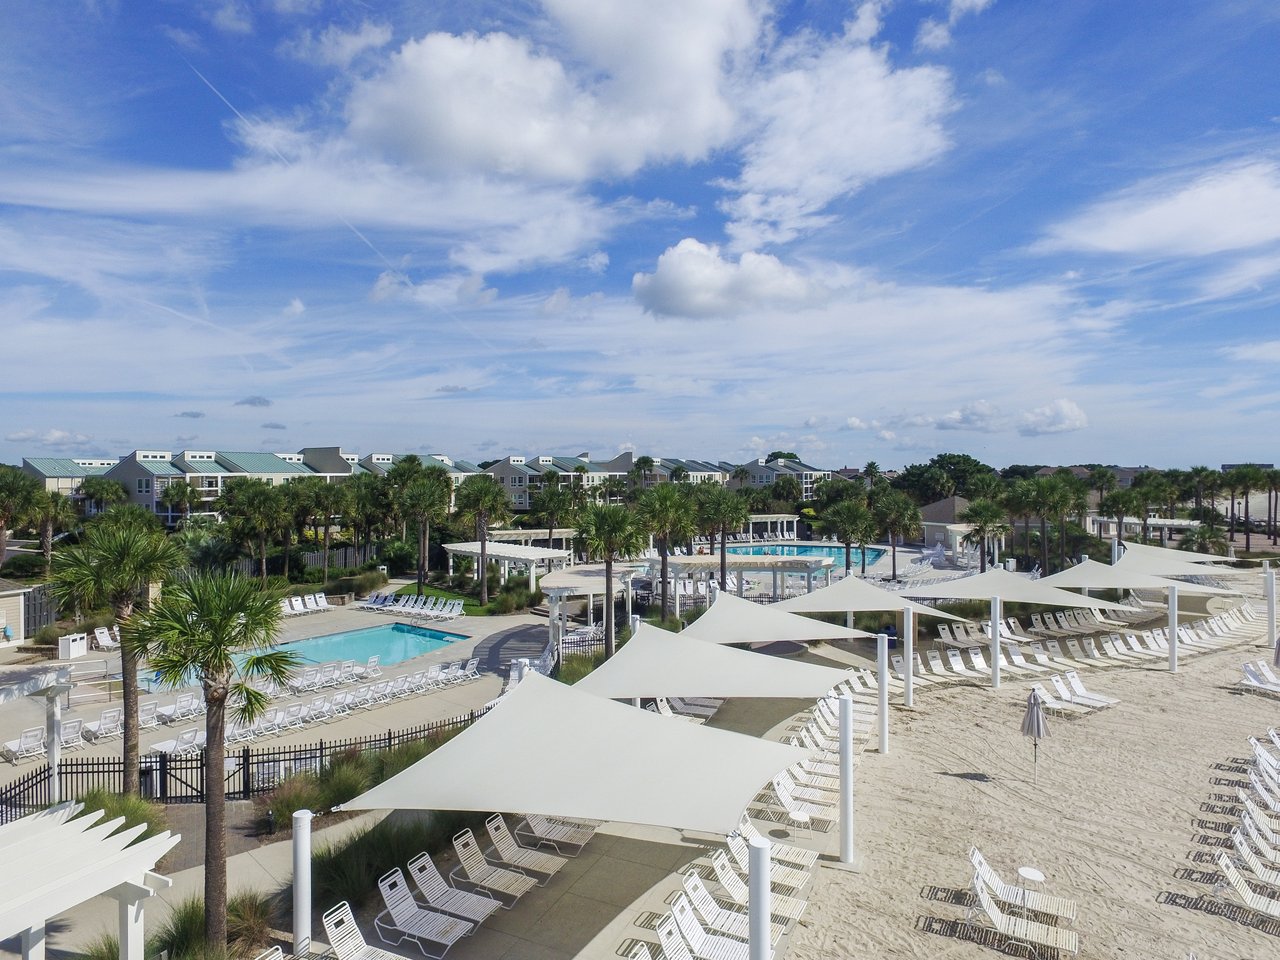
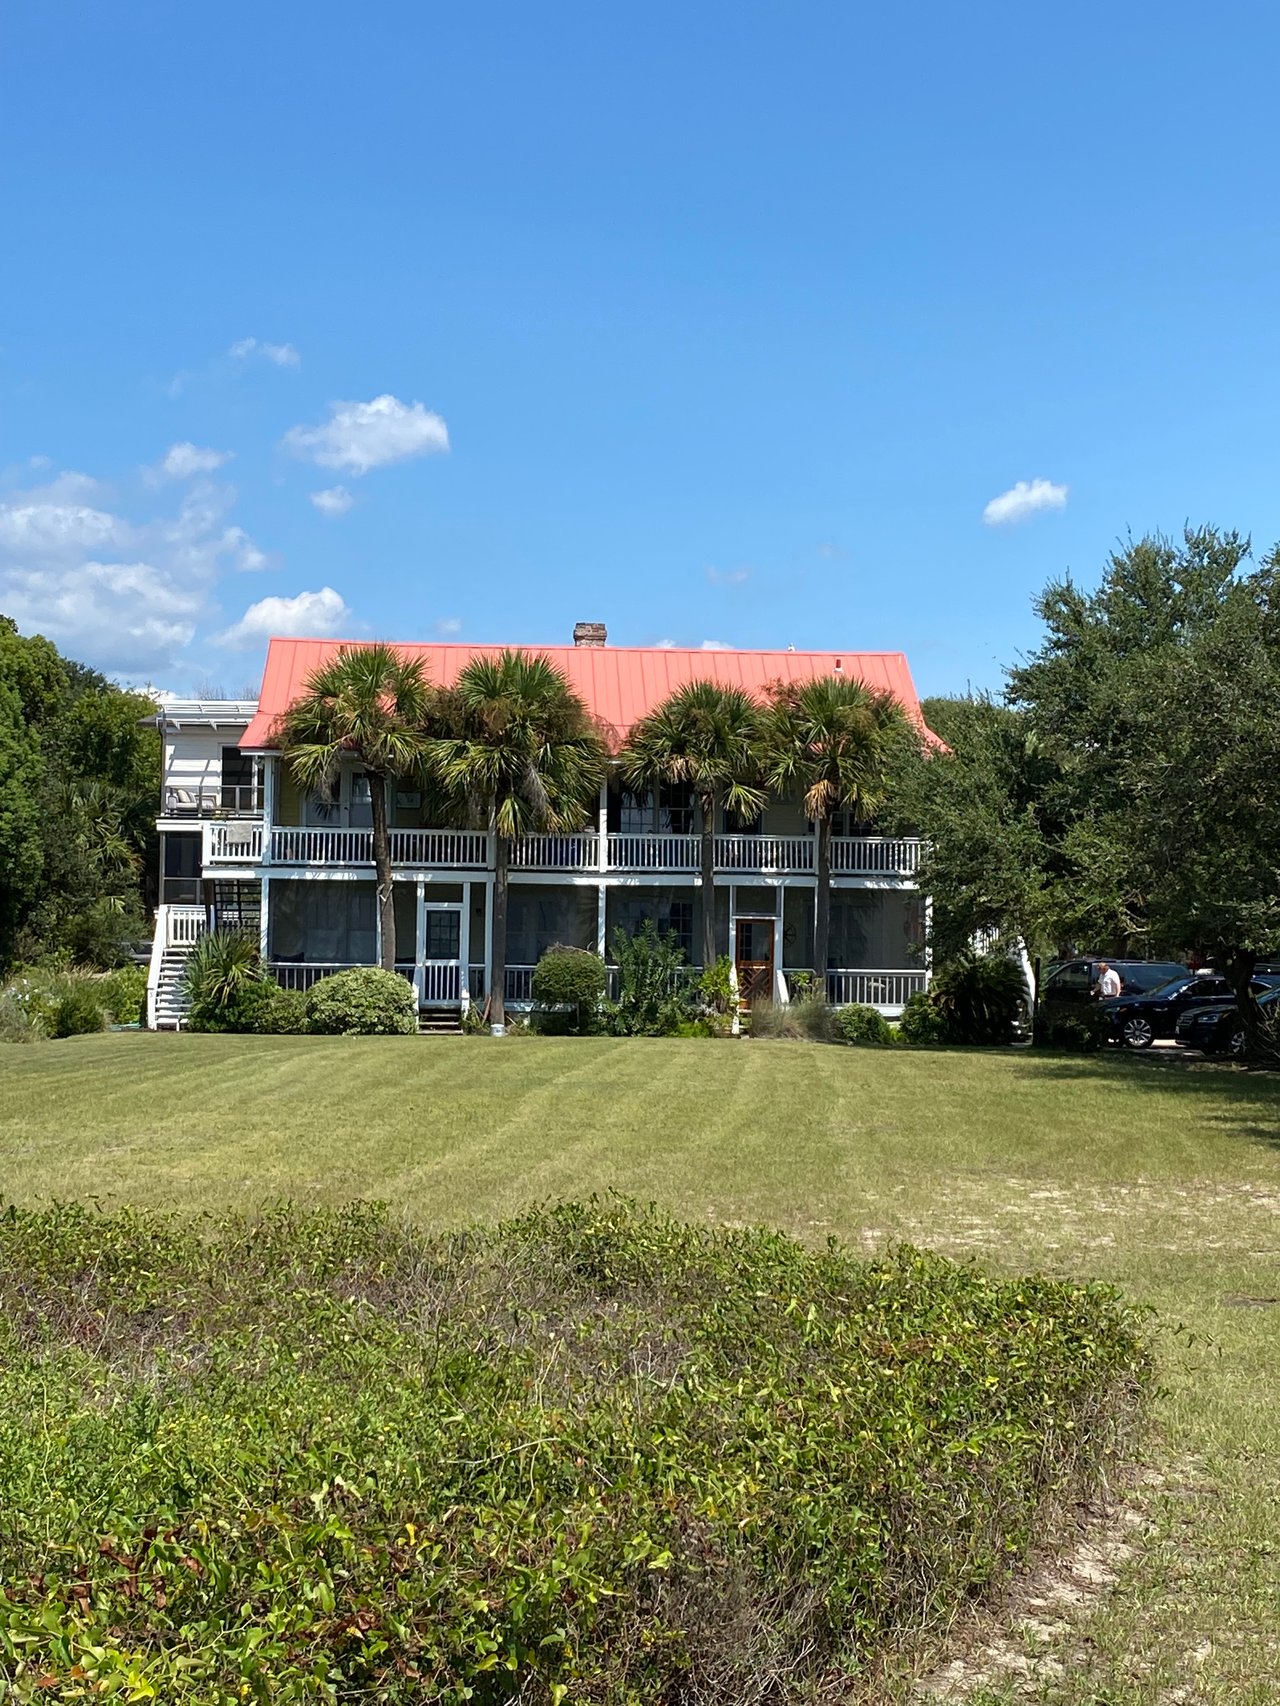
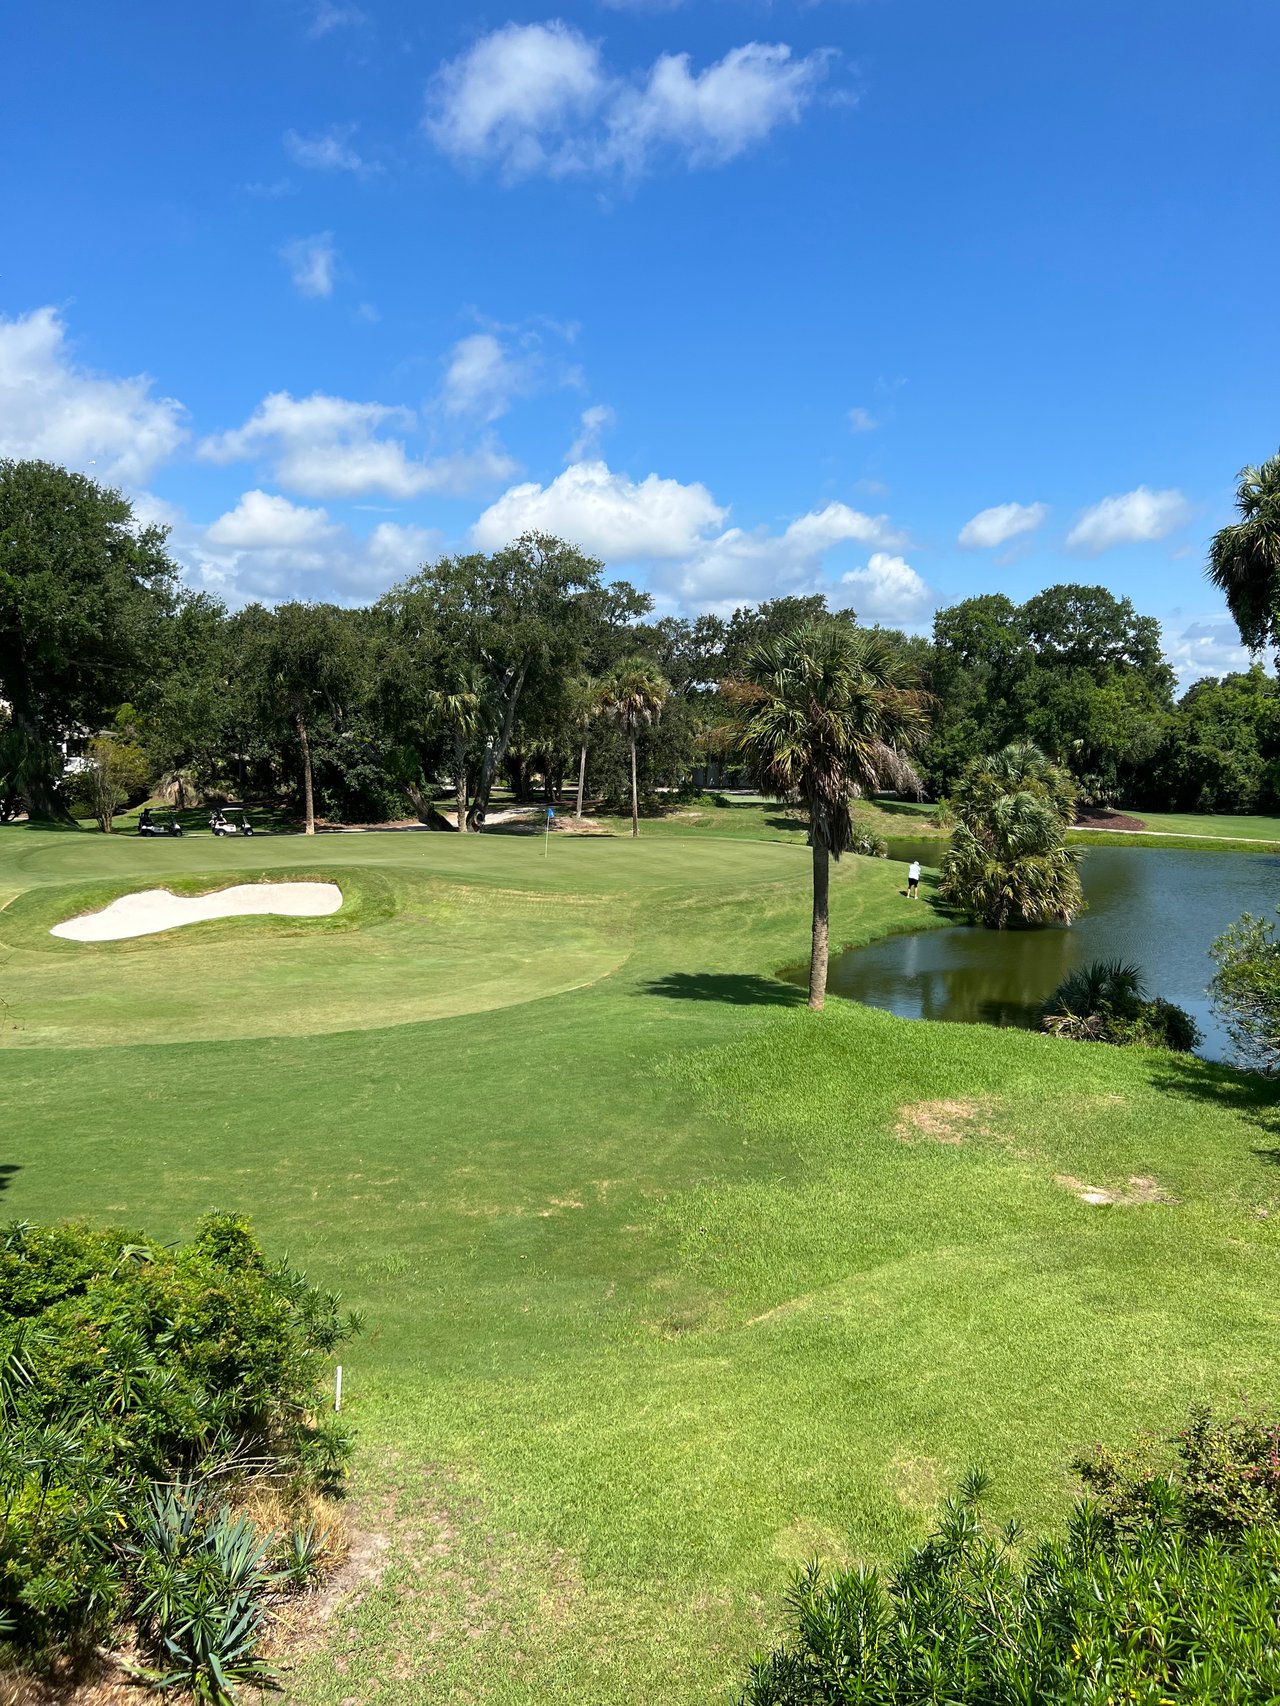
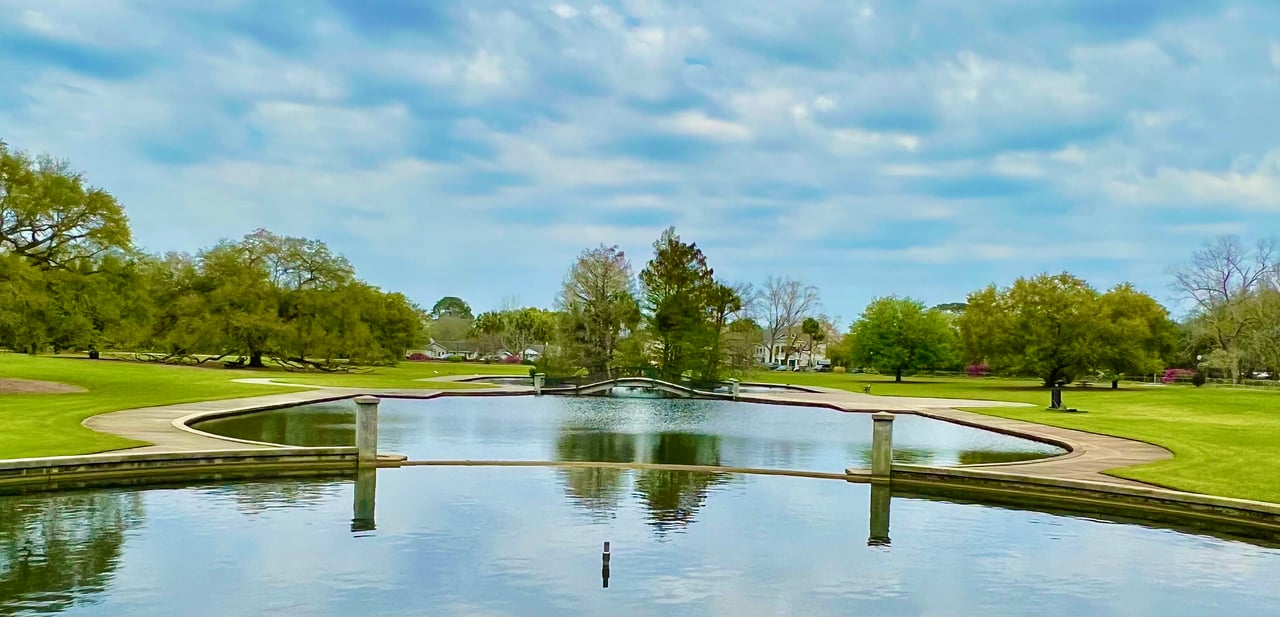
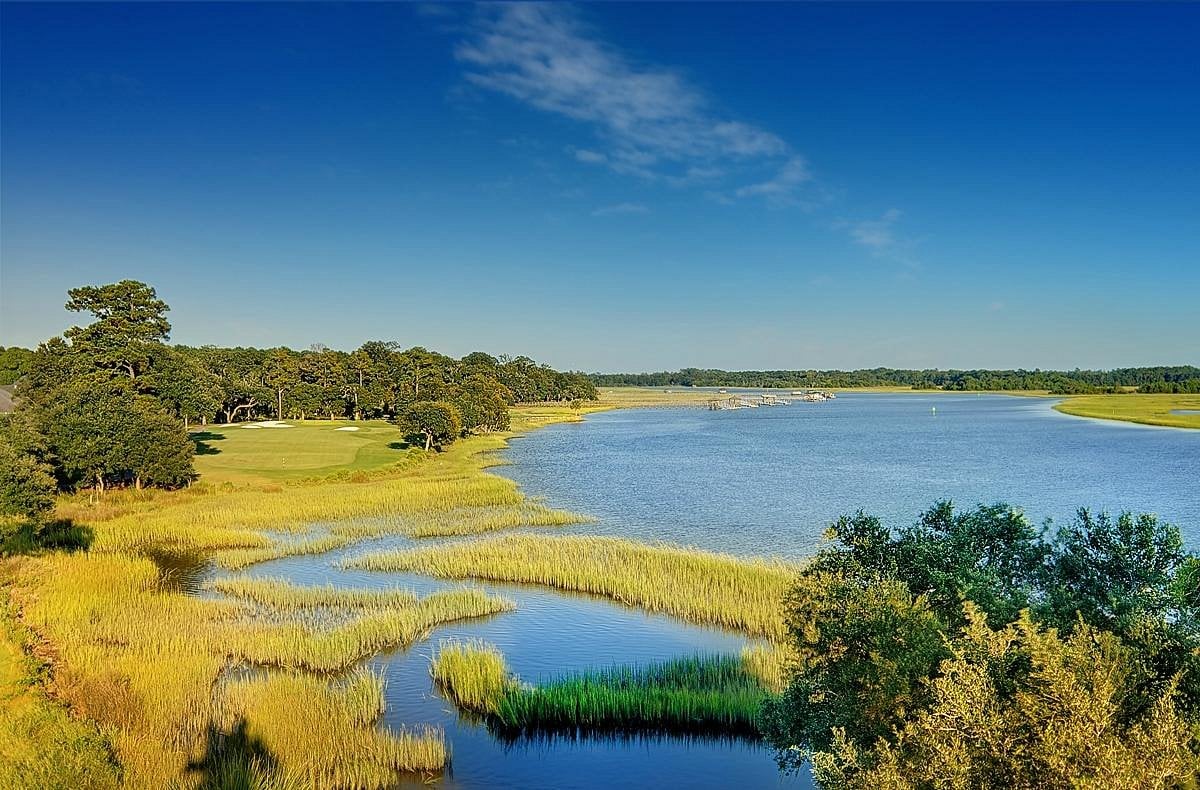
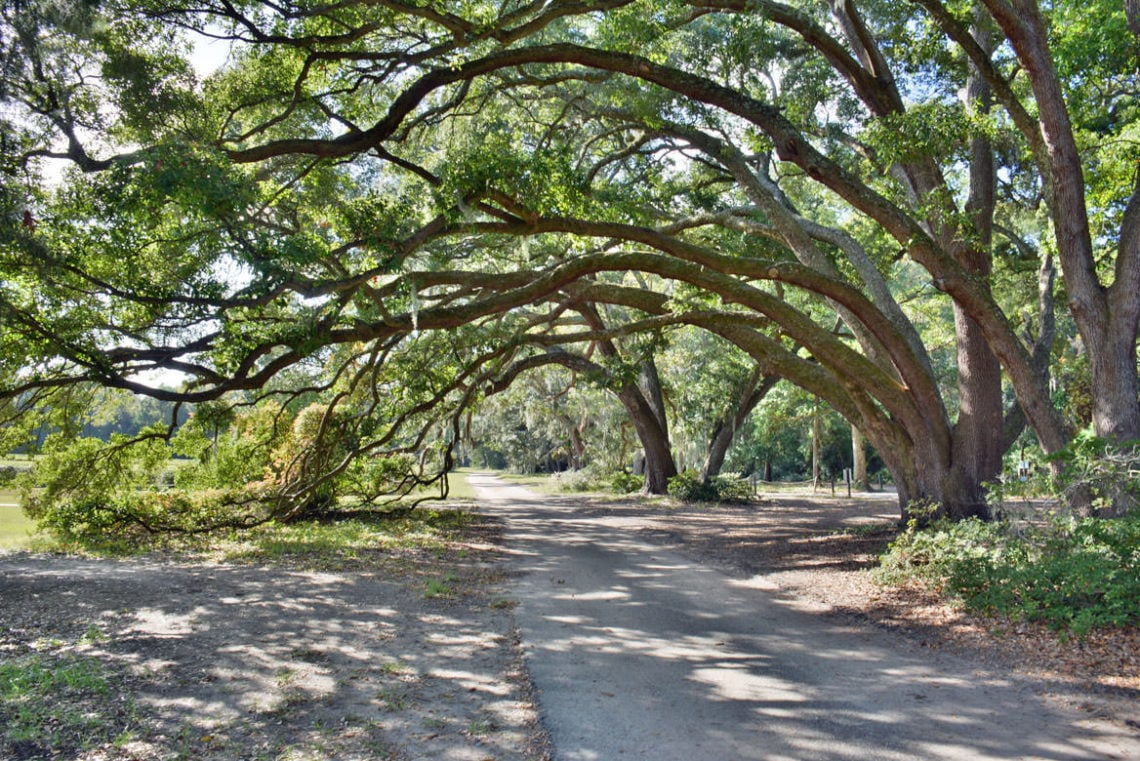
Park Circle is known for its vibrant dining scene, walkable streets, and community events. Other areas like Coosaw Creek Country Club provide golf course and country club lifestyle.
Dining & Local Favorites
Top spots include Evo Pizzeria for artisan pizza, The CODfather for authentic fish & chips, and Holy City Brewing for local craft beer.
117,460 people live in North Charleston, where the median age is 34.3 and the average individual income is $35,740. Data provided by the U.S. Census Bureau.
Total Population
Median Age
Population Density
Average individual Income
There's plenty to do around North Charleston, including shopping, dining, nightlife, parks, and more. Data provided by Walk Score and Yelp.
Explore popular things to do in the area, including Accent on Wine, Coliseum Liquors, and Pie King Cafe.
| Name | Category | Distance | Reviews |
Ratings by
Yelp
|
|---|---|---|---|---|
| Dining | 2.98 miles | 24 reviews | 4.8/5 stars | |
| Dining · $ | 4.23 miles | 21 reviews | 4.8/5 stars | |
| Dining | 4.83 miles | 17 reviews | 4.7/5 stars | |
| Dining | 4.44 miles | 15 reviews | 4.7/5 stars | |
| Dining | 4.16 miles | 20 reviews | 4.7/5 stars | |
| Dining · $ | 3.27 miles | 40 reviews | 4.6/5 stars | |
| Dining | 2.98 miles | 118 reviews | 4.5/5 stars | |
|
|
||||
|
|
||||
|
|
||||
|
|
||||
|
|
||||
|
|
North Charleston has 47,528 households, with an average household size of 2.39. Data provided by the U.S. Census Bureau. Here’s what the people living in North Charleston do for work — and how long it takes them to get there. Data provided by the U.S. Census Bureau. 117,460 people call North Charleston home. The population density is 1,513 and the largest age group is Data provided by the U.S. Census Bureau.
Total Population
Population Density Population Density This is the number of people per square mile in a neighborhood.
Median Age
Men vs Women
Population by Age Group
0-9 Years
10-17 Years
18-24 Years
25-64 Years
65-74 Years
75+ Years
Education Level
Total Households
Average Household Size
Average individual Income
Households with Children
With Children:
Without Children:
Blue vs White Collar Workers
Blue Collar:
White Collar:
717 Folly Road Charleston, SC 29412
717 Folly Road Charleston, SC 29412