Your Real Estate Guide To
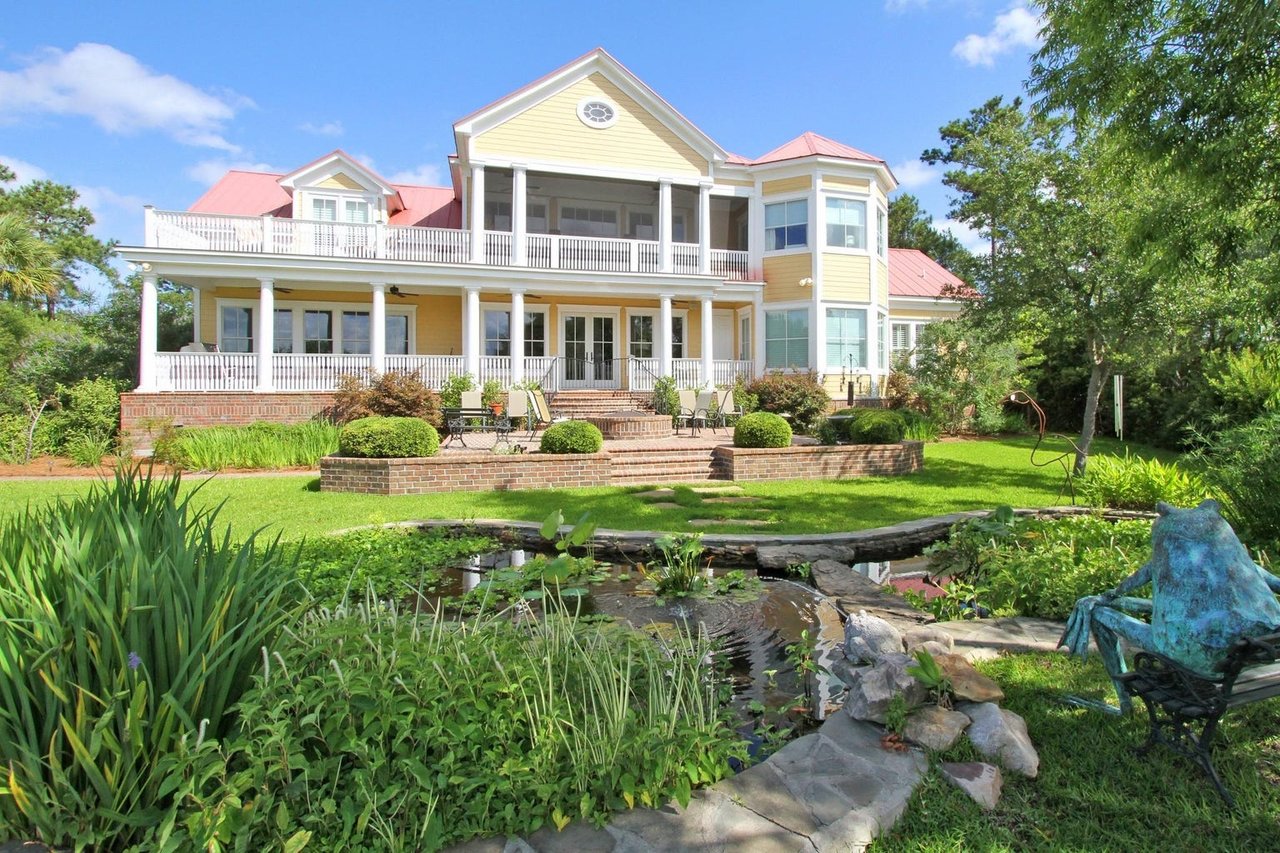
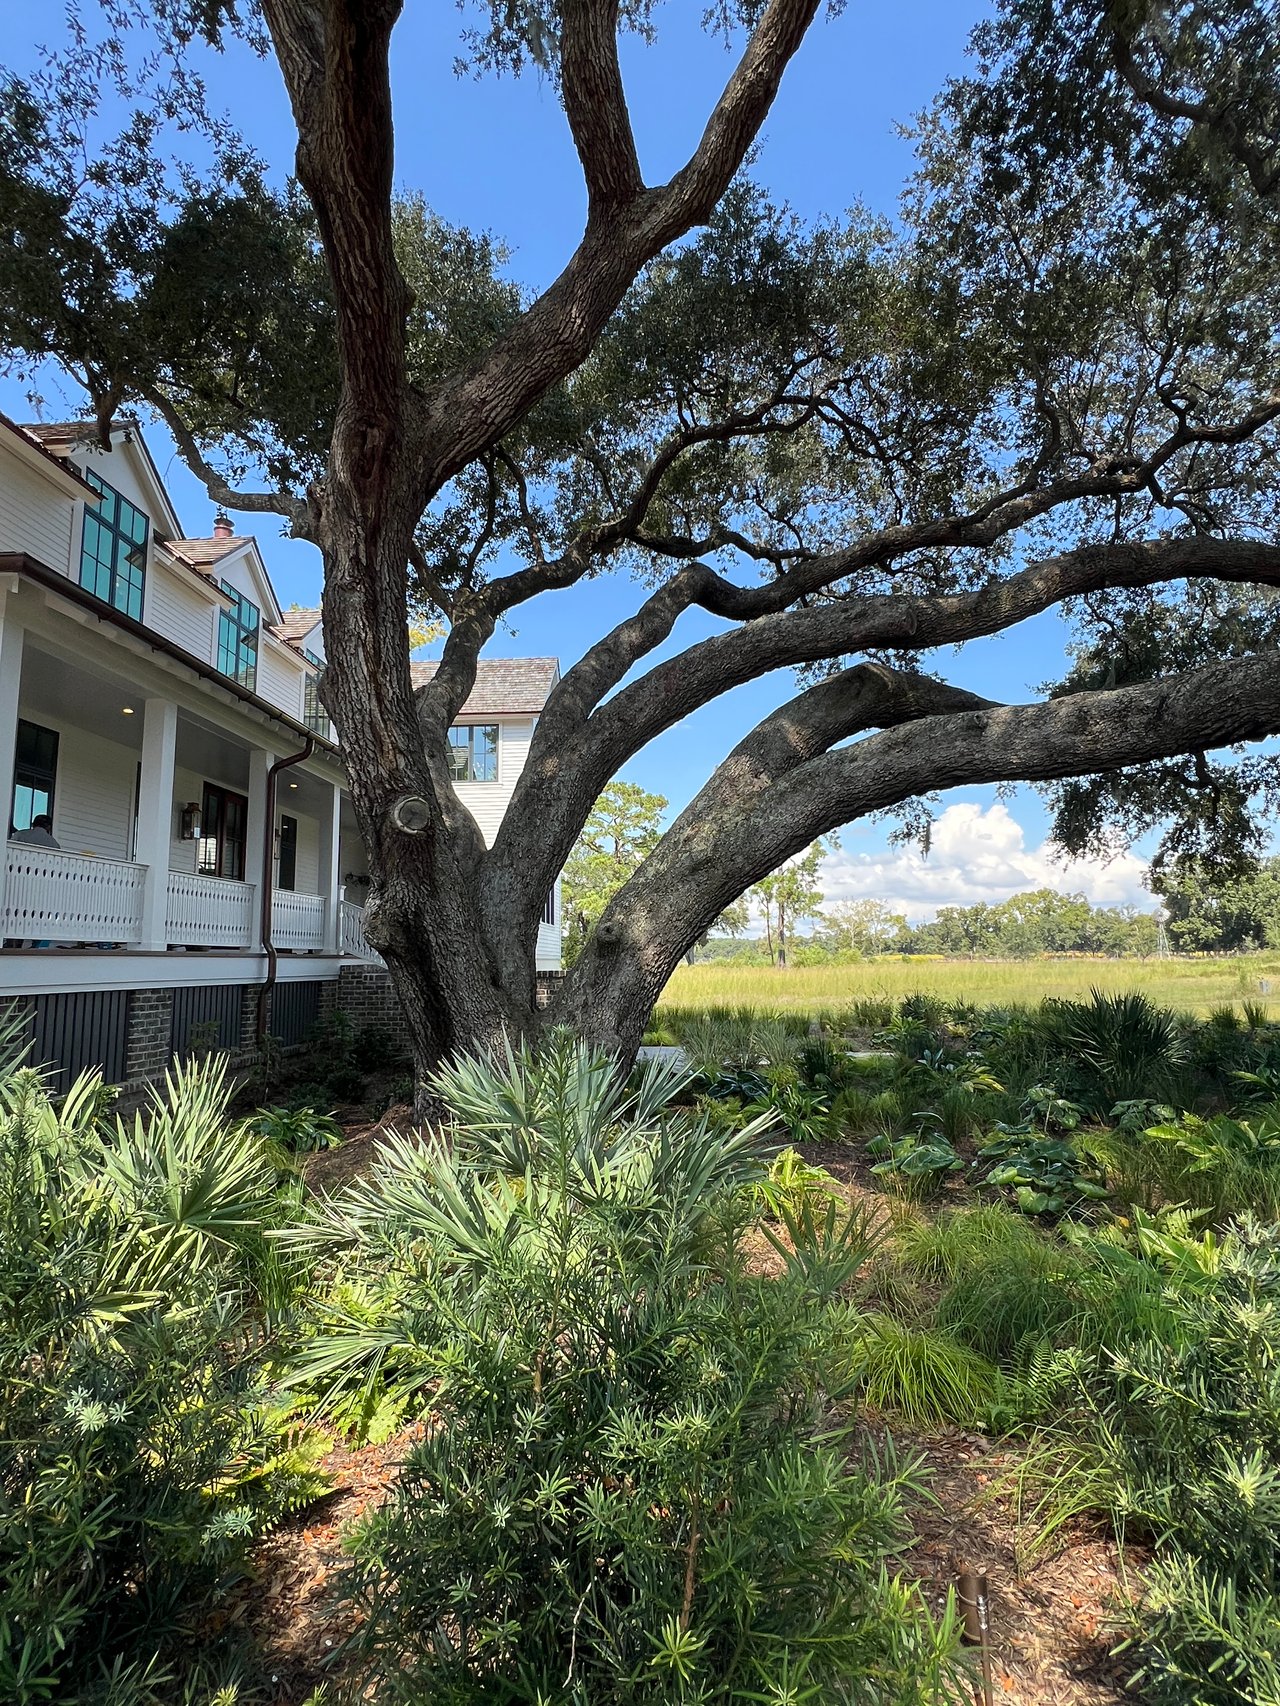
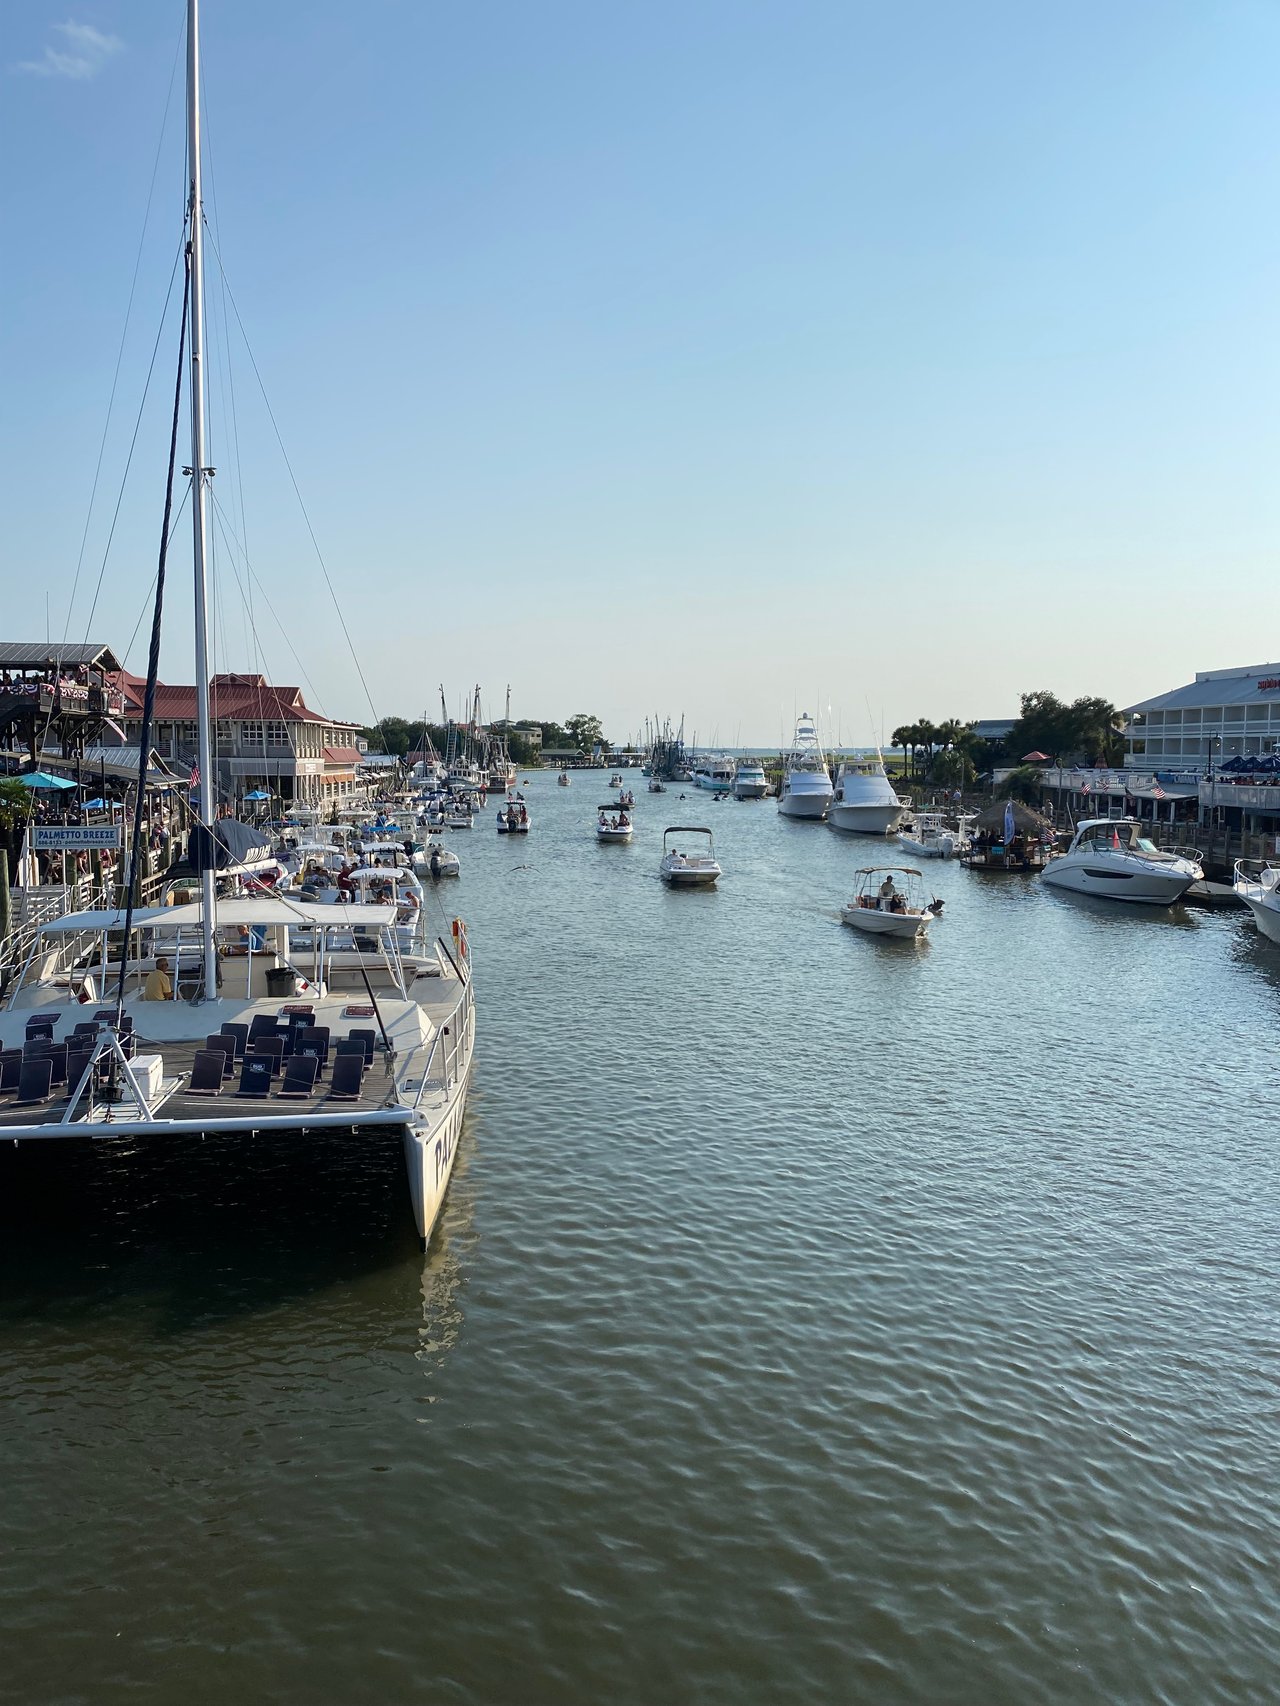
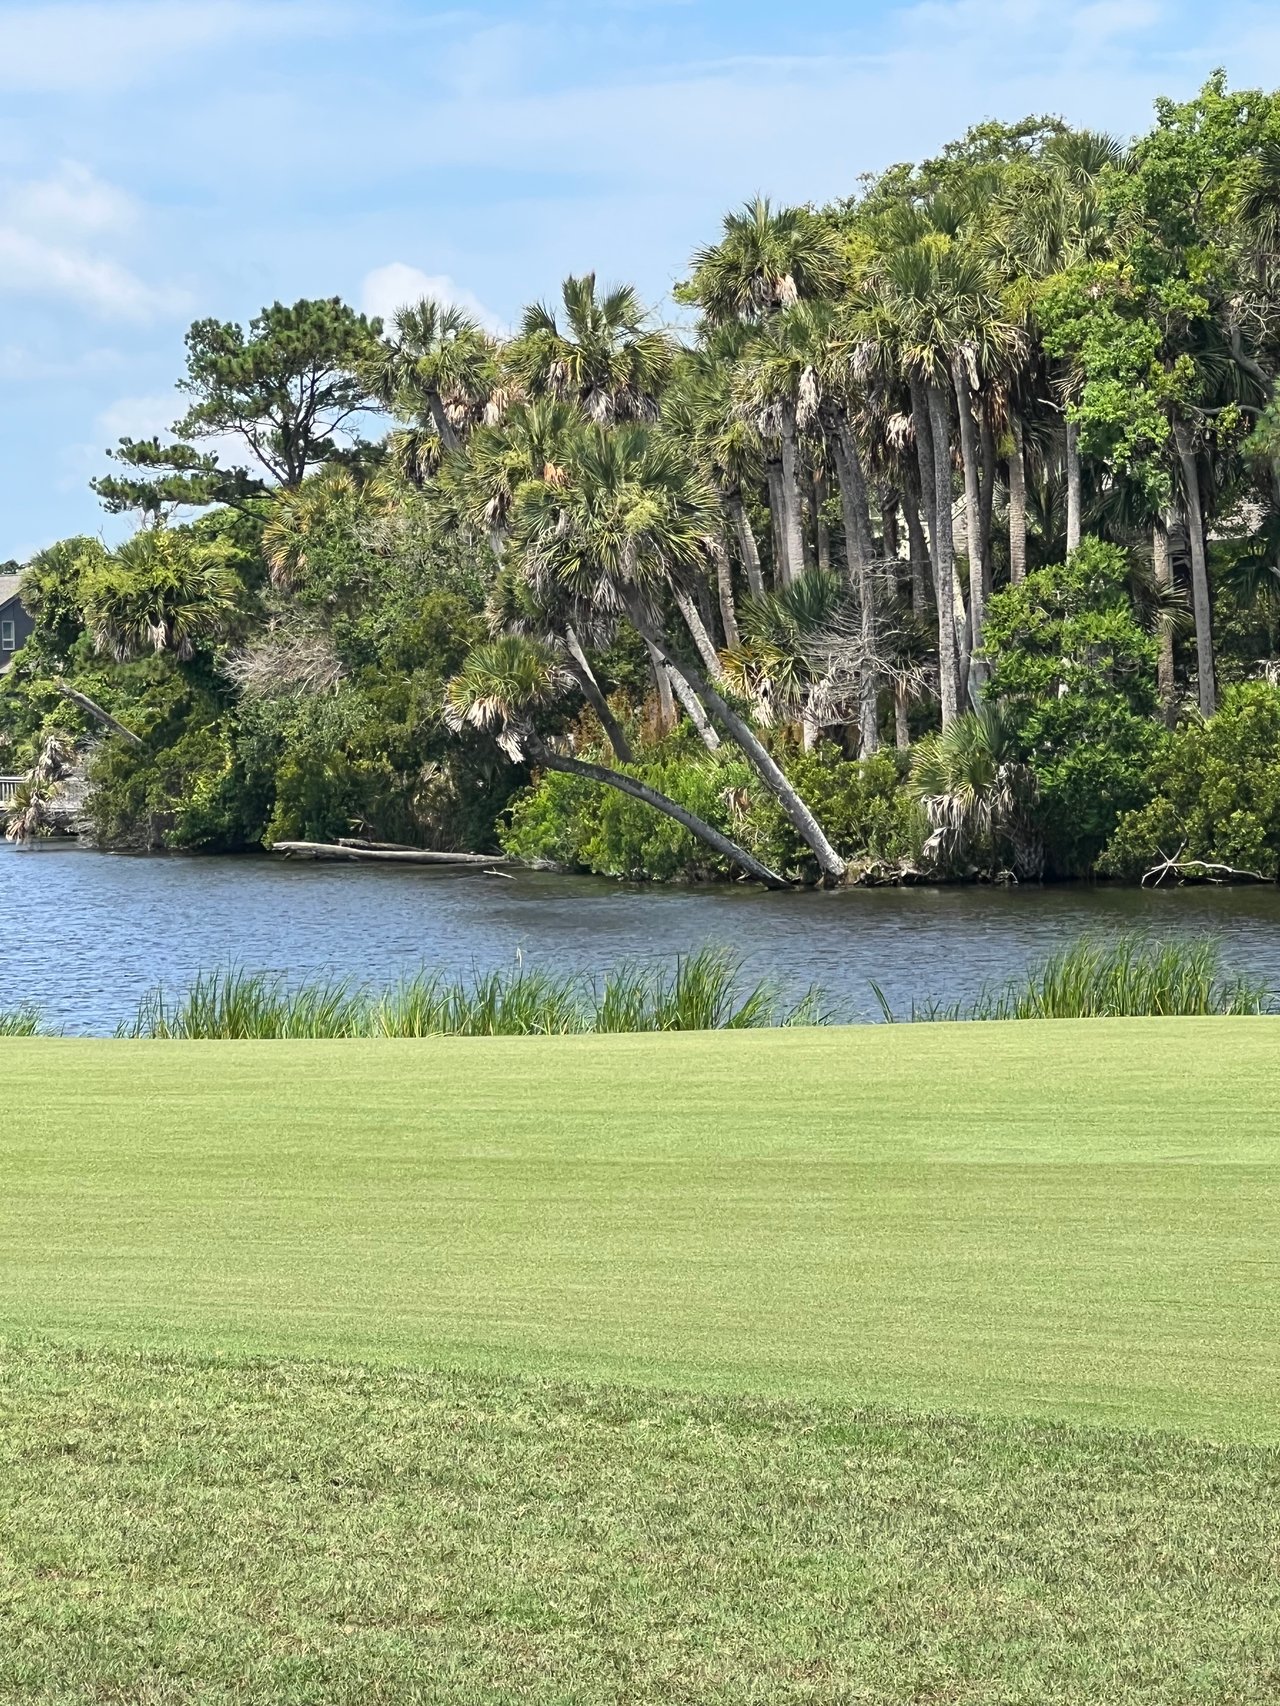
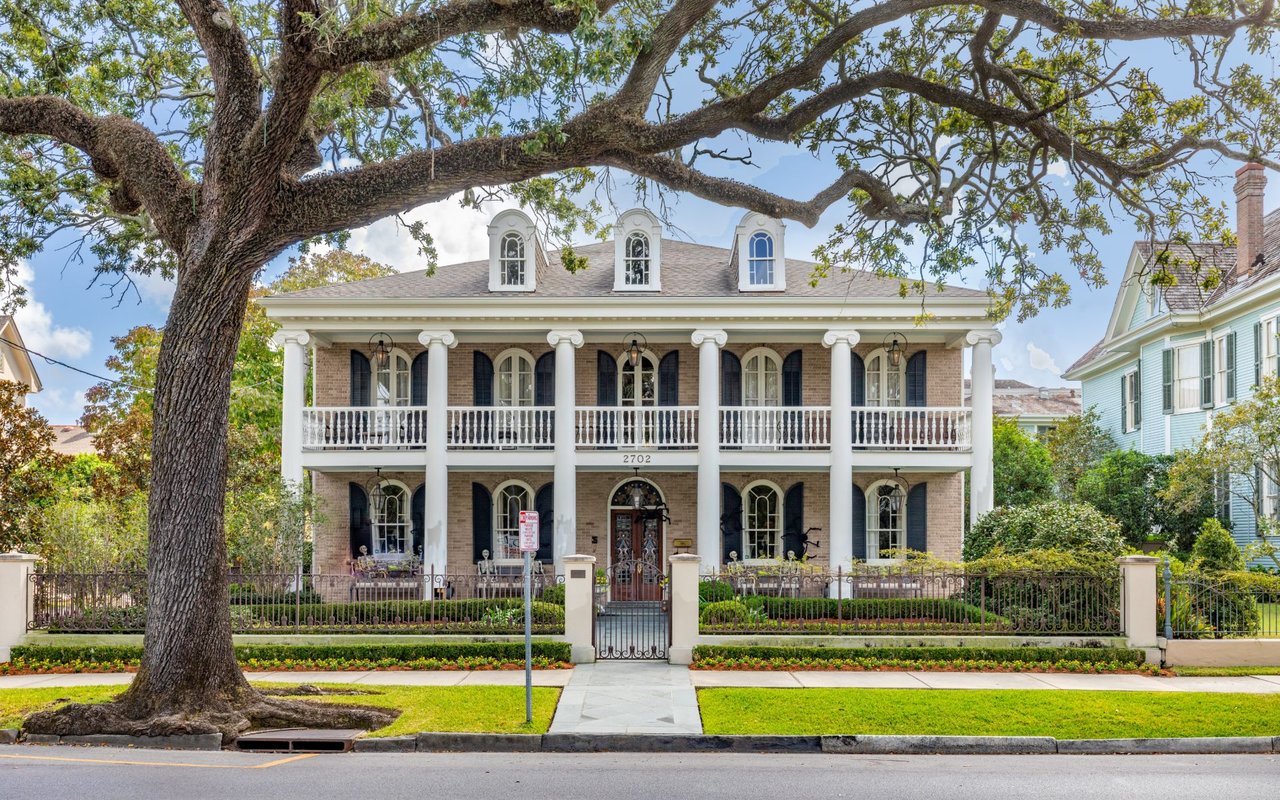
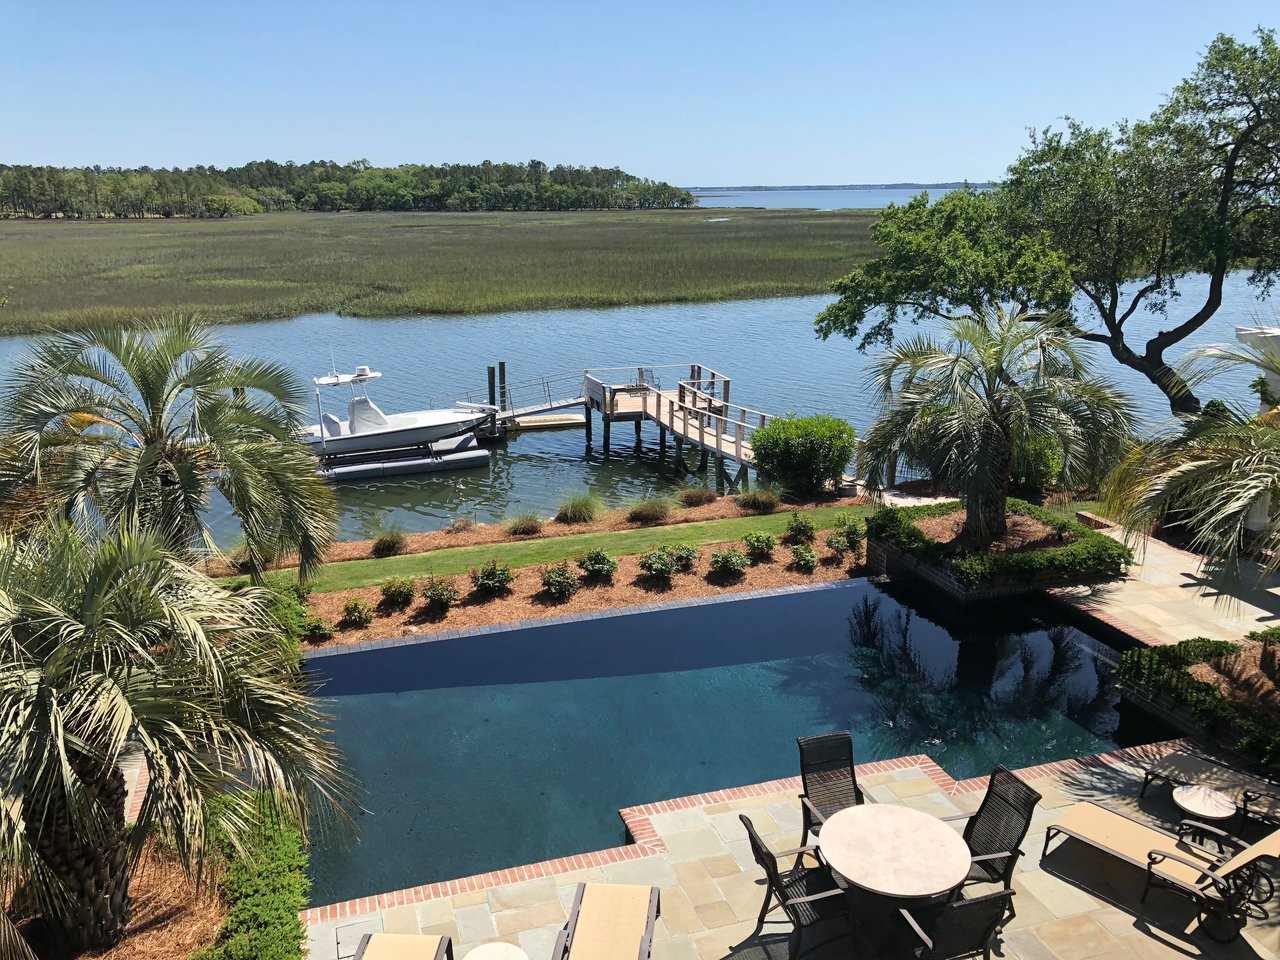
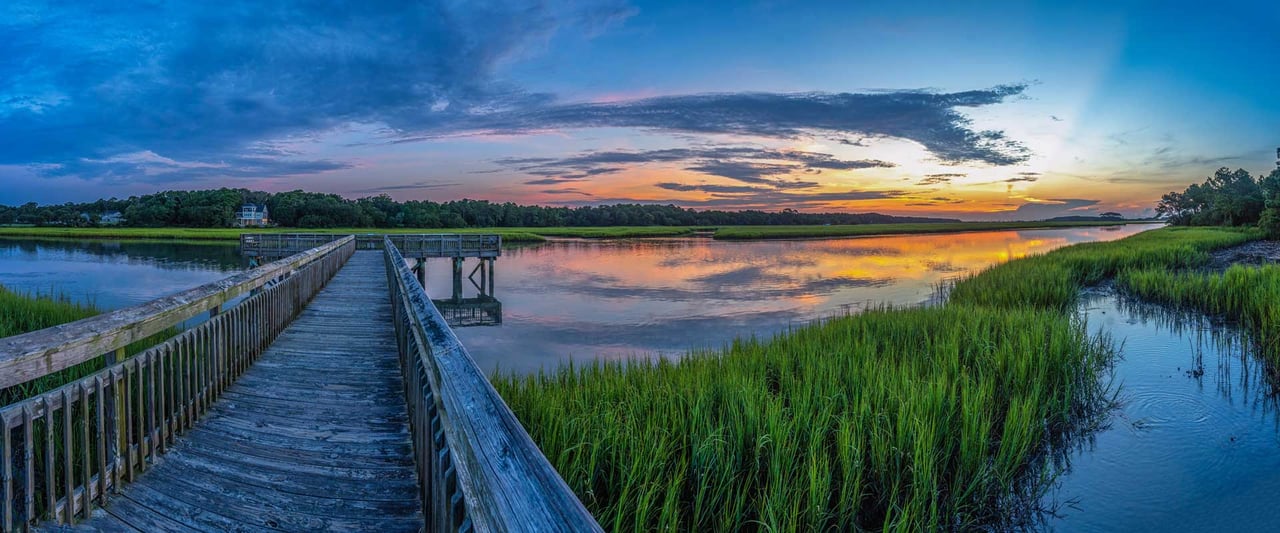
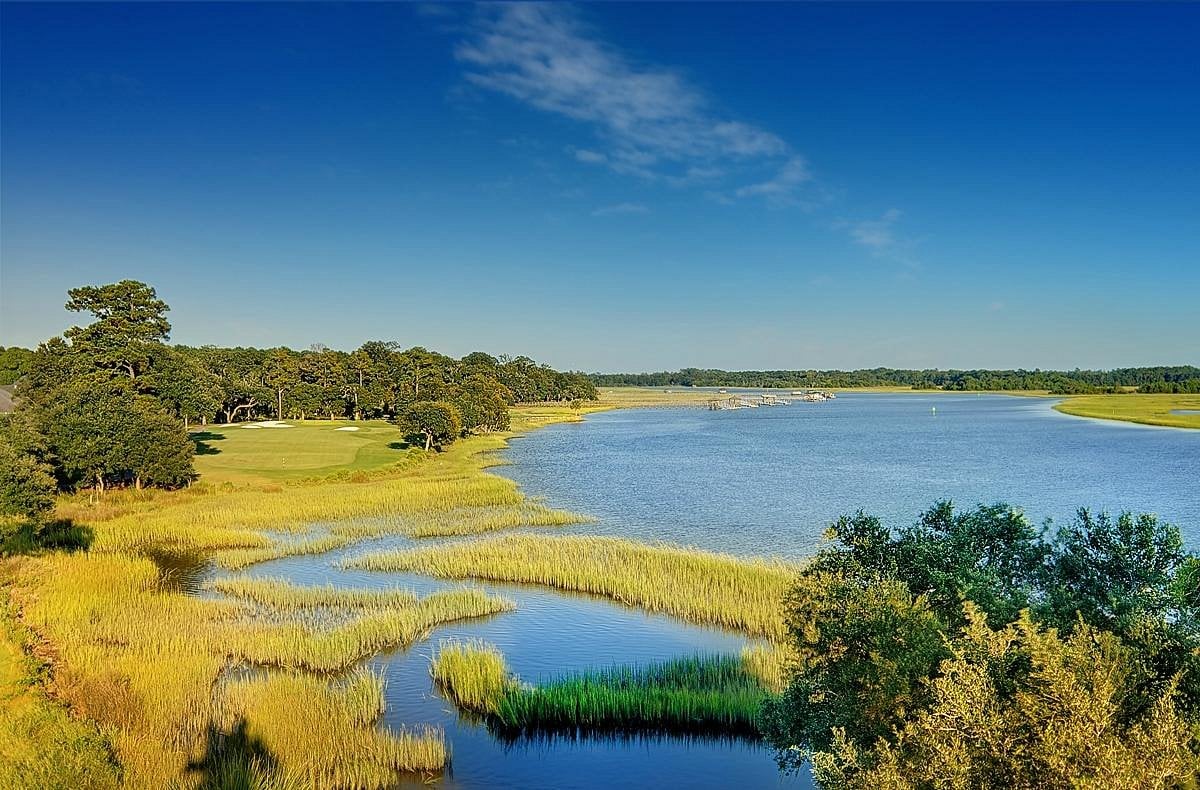
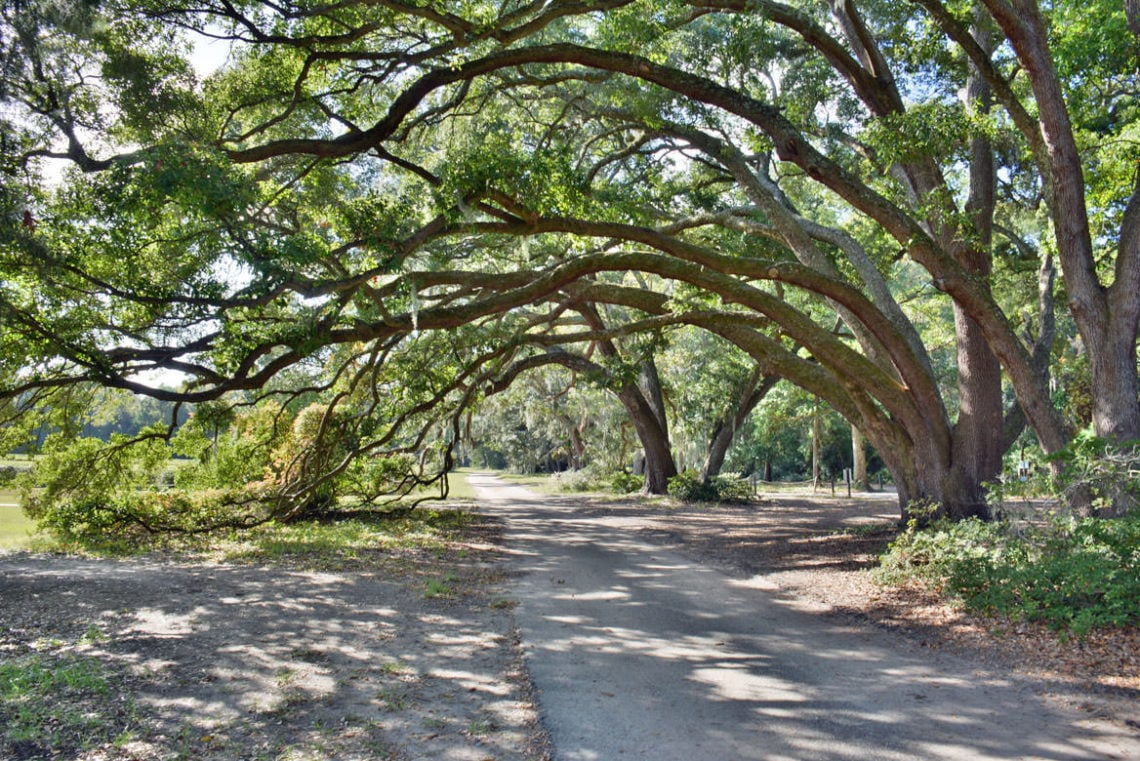
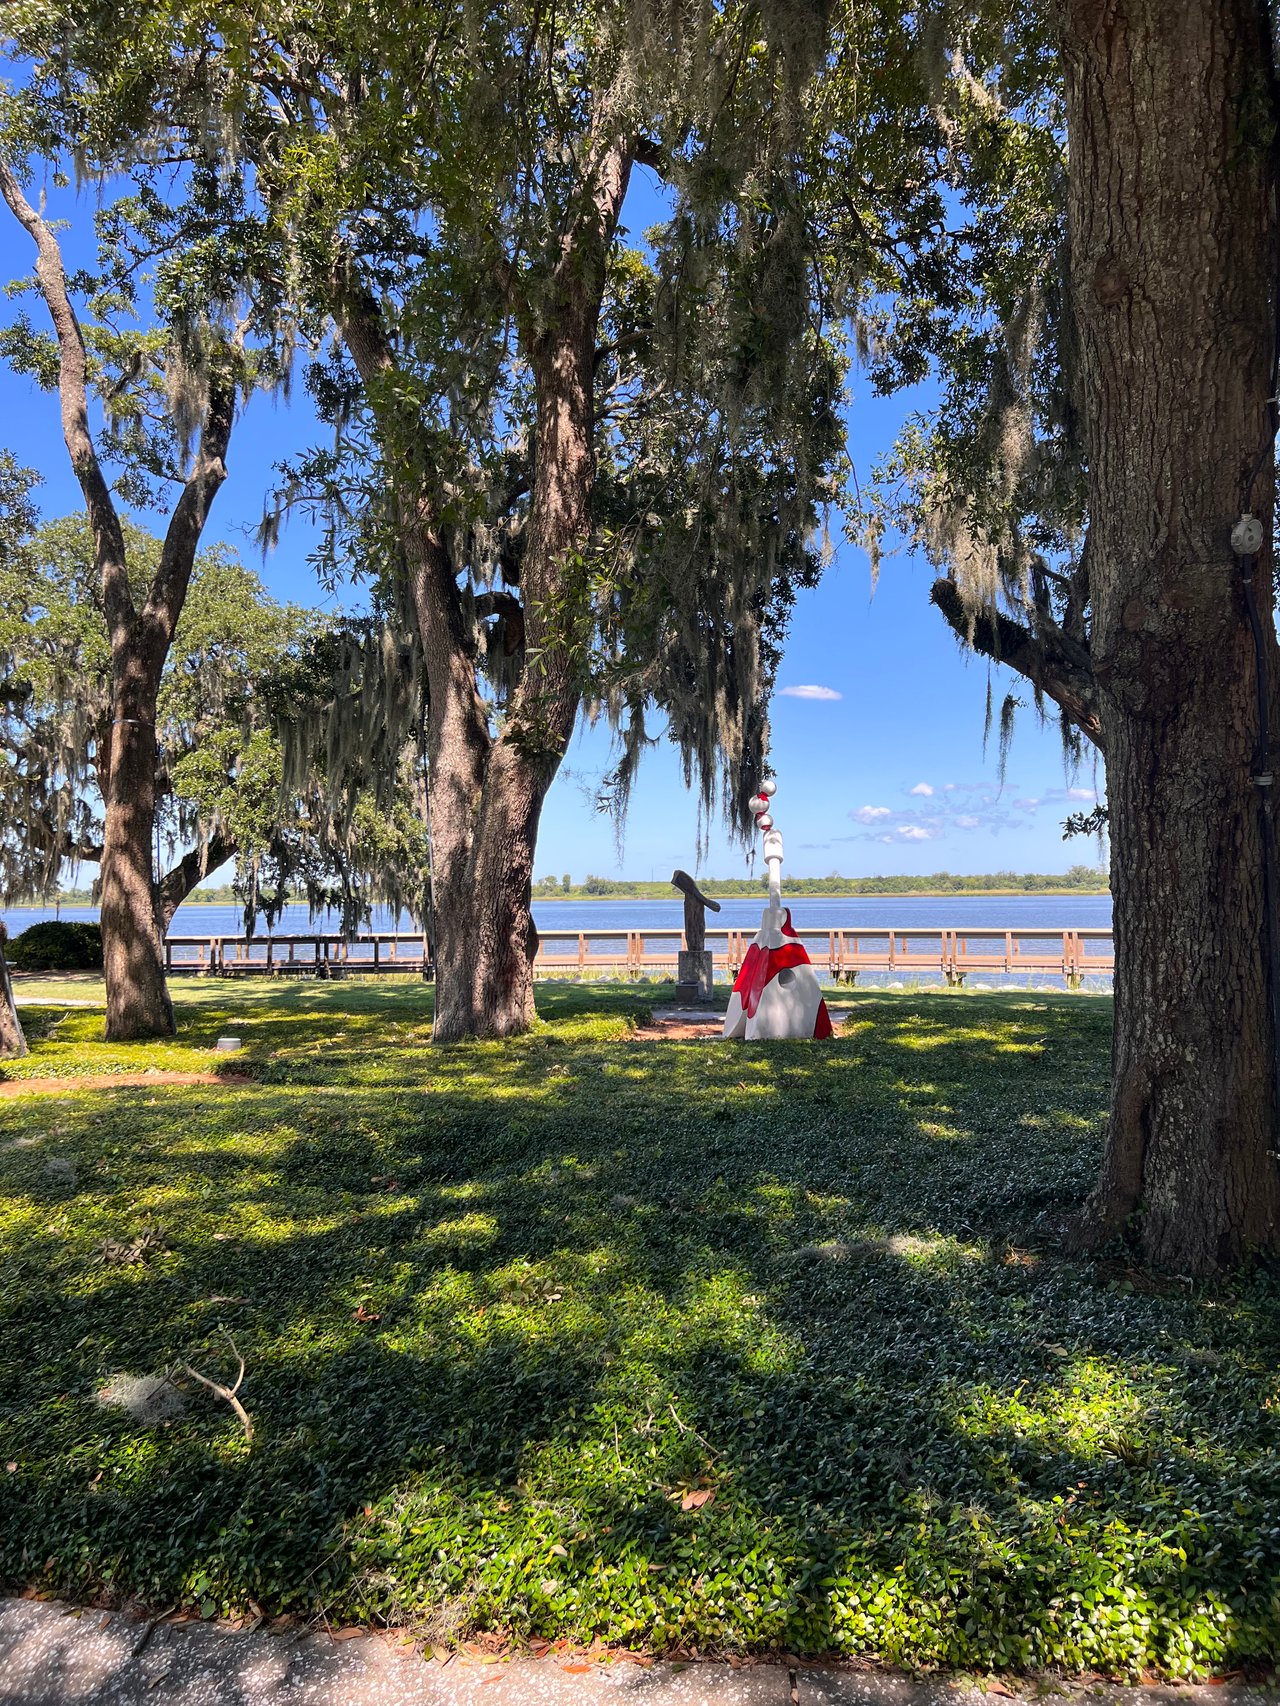
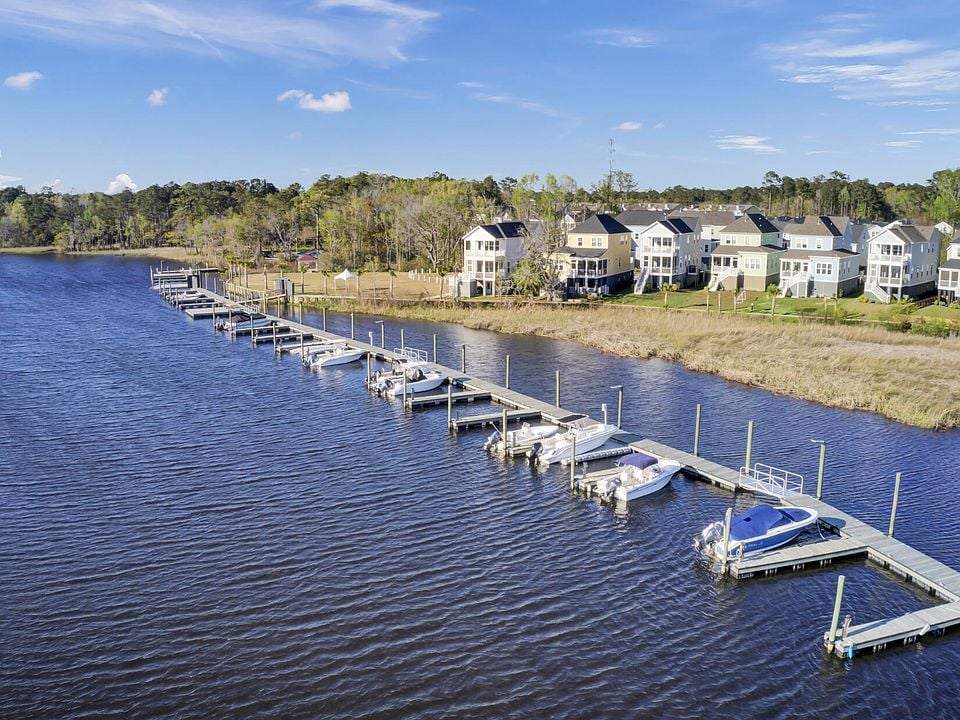
The Wando and Cainhoy area is one of Charleston’s fastest-growing regions, located just northeast of Daniel Island along the Wando River. This area offers deepwater homes, acreage properties, and brand-new residential communities with modern amenities.
Lifestyle & Growth
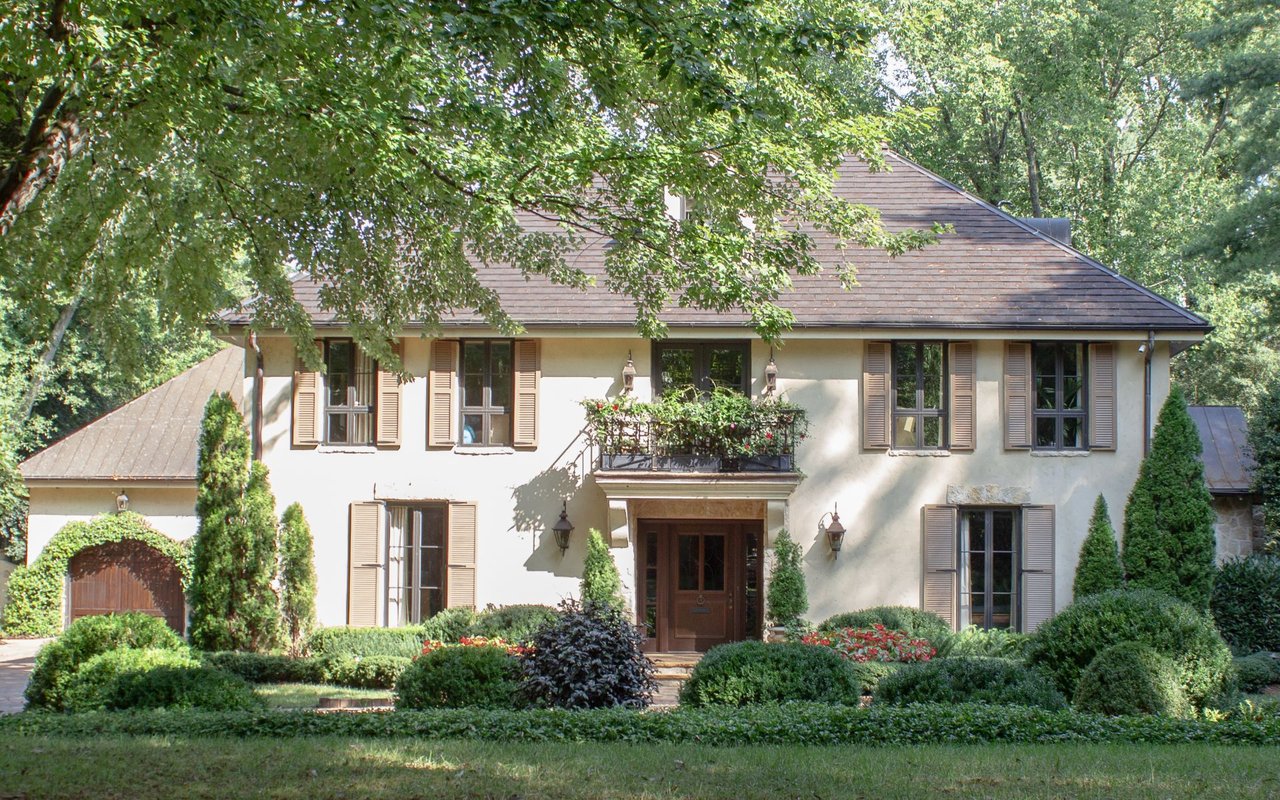
Known for its blend of rural charm and new development, Wando and Cainhoy provide both privacy and convenience. The area is seeing increased growth with planned communities like Cainhoy Plantation and Point Hope, offering parks, trails, and village-style shopping.
Dining & Local Favorites
Enjoy great local restaurants like Dog & Duck for amazing sandwiches and Coastal Skillet for a local breakfast favorite.
40 people live in Wando & Cainhoy, where the median age is 36 and the average individual income is $54,771. Data provided by the U.S. Census Bureau.
Total Population
Median Age
Population Density
Average individual Income
There's plenty to do around Wando & Cainhoy, including shopping, dining, nightlife, parks, and more. Data provided by Walk Score and Yelp.
Explore popular things to do in the area, including Sweet Frog Premium Frozen Yogurt, 16 Handles, and Blade & Bull Axe Throwing.
| Name | Category | Distance | Reviews |
Ratings by
Yelp
|
|---|---|---|---|---|
| Dining | 2.38 miles | 12 reviews | 4.9/5 stars | |
| Dining | 0.41 miles | 6 reviews | 4.8/5 stars | |
| Active | 4.5 miles | 9 reviews | 5/5 stars | |
| Active | 4.54 miles | 17 reviews | 4.8/5 stars | |
|
|
||||
|
|
||||
|
|
||||
|
|
||||
|
|
||||
|
|
Wando & Cainhoy has 7 households, with an average household size of 3. Data provided by the U.S. Census Bureau. Here’s what the people living in Wando & Cainhoy do for work — and how long it takes them to get there. Data provided by the U.S. Census Bureau. 40 people call Wando & Cainhoy home. The population density is 4,440 and the largest age group is Data provided by the U.S. Census Bureau.
Total Population
Population Density Population Density This is the number of people per square mile in a neighborhood.
Median Age
Men vs Women
Population by Age Group
0-9 Years
10-17 Years
18-24 Years
25-64 Years
65-74 Years
75+ Years
Education Level
Total Households
Average Household Size
Average individual Income
Households with Children
With Children:
Without Children:
Blue vs White Collar Workers
Blue Collar:
White Collar:
717 Folly Road Charleston, SC 29412
717 Folly Road Charleston, SC 29412